Single-cell RNA sequencing (scRNA-seq) allows genetic makeup to be studied at the level of single cells. The first whole transcriptome analysis of a single cell took place in 2009, and the approach has rapidly grown in popularity ever since[i]. scRNA-seq has become one of the primary tools used to answer fundamental questions about the properties of individual cells and the development of cellular subpopulations.
Single-cell analyses help researchers make biological discoveries that deviate from the results expected from traditional profiling methods that assess bulk populations. The thirst for discovery has led to an explosion in the amount of scRNA-seq data generated, and its analysis promises to overcome the limitations of bulk RNA-seq data, in which cellular heterogeneity is undermined.
Applications of scRNA-seq analysis
There are many valuable applications of scRNA-seq analysis in the life science and pharmaceutical industries. Some of the most popular are:
- Transcriptional profiling
- Cell state characterization
- Cell lineage trajectories
- Targeted therapeutics
- Patient stratification
- Drug discovery and development
- Inferring disease susceptibilities
Challenges in the application of scRNA-seq analysis
While single-cell analysis is gaining momentum, there remain some significant challenges to overcome before it can be utilized to its full potential. scRNA-seq analysis workflows lag behind another next-generation sequencing (NGS)-based studies in terms of the tools and algorithms available for sequencing, data extraction, processing, and interpretation. There are limitations, for example, in the read depth available for scRNA-seq data compared to bulk RNA-seq data. There are a number of other significant roadblocks to the successful application of scRNA-seq analysis, including:
- Data integration
- Data management
- Scalability
- Affordability
- Limited analysis algorithms and packages
- Lack of structured pipelines for end-to-end analysis
Several biotech companies and research organizations have developed sequencing and analysis tools to address the most pressing challenges. Many have found that combining scRNA-seq with other technologies can alleviate some issues. Combining the capabilities of scRNA-seq and bulk RNA-seq technologies via deconvolution, for example, has helped researchers formulate mechanisms that address the limitations of both.
scRNA-seq data collection, processing, and analysis
scRNA-seq technology has improved significantly since its inception. The introduction of techniques such as in situ barcoding, spatial transcriptomics, and nanodroplet production has dramatically improved the ability to isolate single cells. Precise isolation of relevant cells by single-cell isolation techniques like fluorescence-activated cell sorting (FACS), microfluidic system and laser microdissection play a vital role in accurate deciphering of genetic and molecular mechanisms specific to a cell.
Once isolated, RNA data is converted to complementary DNA (cDNA) and further amplified using polymerase chain reaction (PCR) or in vitro transcription (IVT). Most sequencing platforms have incorporated PCR and IVT, but researchers must proceed with caution. Both techniques are susceptible to amplification bias, so some studies have included unique molecular identifiers (UMIs) to offset the risk. This is one example of the strategies developed to maintain scientific rigor in scRNA-seq projects. Sequencing platforms are constantly evolving to meet challenges as they arise without compromising on the efficiencies provided by these emerging technologies.
The scRNA-seq analysis process
1. Data processing & QC
- Quality control
- Alignment and quantification
- Normalization
- Batch effect correction
- Low-quality cell filtration
2. Primary analysis
- HVG selection
- Dimensionality reduction
- Clustering
- Cell-type annotation
3. Secondary analysis
- Statistical analysis
- GO and KEGG enrichment
- TF prediction
- Cell trajectory
- Cell interaction
- Cell cycle
4. Tertiary analysis
- Combinatorial analysis including bulk RNA-Seq, flow cytometry, CRISPR, etc.
Following extraction, scRNA-seq data must be assessed for consideration in downstream analysis (fig. 1). Technical and biological variation in the acquired data can be difficult to interrogate due to high dropouts, batch effect, and sample variation, as well as confounding effects caused by the presence of mitochondrial genes in stress situations. Only high-quality data should be retained to avoid these complications and maximize the accuracy of the concluding results. In the first phase of the process, alignment, quantification, and normalization tasks are required, with standards maintained by rigorous quality control measures.
Primary and secondary analysis of appropriately selected and organized data can provide valuable insight into the biological processes of individual cells. Researchers must choose the most appropriate analysis tools for the specific actions in these stages to ensure the analysis meets project objectives and the workflow remains optimized.
Primary analysis includes highly variable gene (HVG) identification, dimensionality reduction via PCA, clustering, cell type annotation, and statistical analysis. Secondary analysis is deeper, using gene ontology and pathways to fortify extracted data with biological context. Trace cell trajectory, cell interaction, and cell cycles are mapped in this phase, and transcription factor predictions are produced for specific cell types. To comprehensively integrate information from multiple platforms, tertiary analysis can also be explored. Outputs from scRNA-seq data can be combined with those from flow cytometry, for example.
Although there has been incredible progress in the development of scRNA-seq data analysis techniques, there is a lack of consensus in the scientific community about which techniques yield the most reliable results. Without a standardized approach, there remain frequent instances of friction between methods and across analysis packages. Many software and data companies are offering competing products and services in this emerging market, and some are beginning to carve out niches in the field. The Sajita Lab at the New York Genome Center launched Seurat in 2015, and it has since become one of the most widely employed toolkits for single-cell genomics. Excelra also successfully provides comprehensive analysis and visualization solutions to R&D teams engaged in pioneering single-cell research.
Excelra’s scRNA-seq data management expertise
- In silico validation with public datasets
- Dataset curation and annotation
- Conversion of data into standard, consistent, usable formats
Since the closing decades of the twentieth century, biological data has increasingly been made available to the public domain. The accessibility of data has undoubtedly contributed to its improved collation and the development of techniques like single-cell RNA sequencing. As scRNA-seq data often requires in silico validation of results, the ability to cross-examine and benchmark against open-source data sets is clearly beneficial to life science R&D projects. However, public domain data is inherently challenging to use effectively, as it exists in conflicting and incompatible file formats with inconsistent properties. Public data repositories use unique, proprietary formats, so integrating and harmonizing data from multiple sources adds a layer of complexity that can inhibit progress. Fortunately, Excelra has emerged as an industry leader in this complex but vital service.
Excelra’s scientific experts and technological innovators have reviewed all available public repositories of scRNA-seq data. We’ve mapped out the different characteristics of their data sets and determined which repositories provide the most appropriate data aligned to a project’s objective.
Whatever your requirements, we design intelligent analysis workflows to radically streamline your analysis process. Given the size and complexity of scRNA-seq data, we develop workflows optimized for its specific properties and can input and output any file format you need (fig. 2).
Our harmonization exercises often require the conversation of data files like FASTA, .bcl, .bam, etc. to Hierarchical Data Format version 5 (HDF5). It’s particularly useful for storing and loading large, on-demand, heterogenous, and esoteric data. Other popular formats include .ds file, .loom, barcodes.tsv, gene.tsv, and matrix.max.
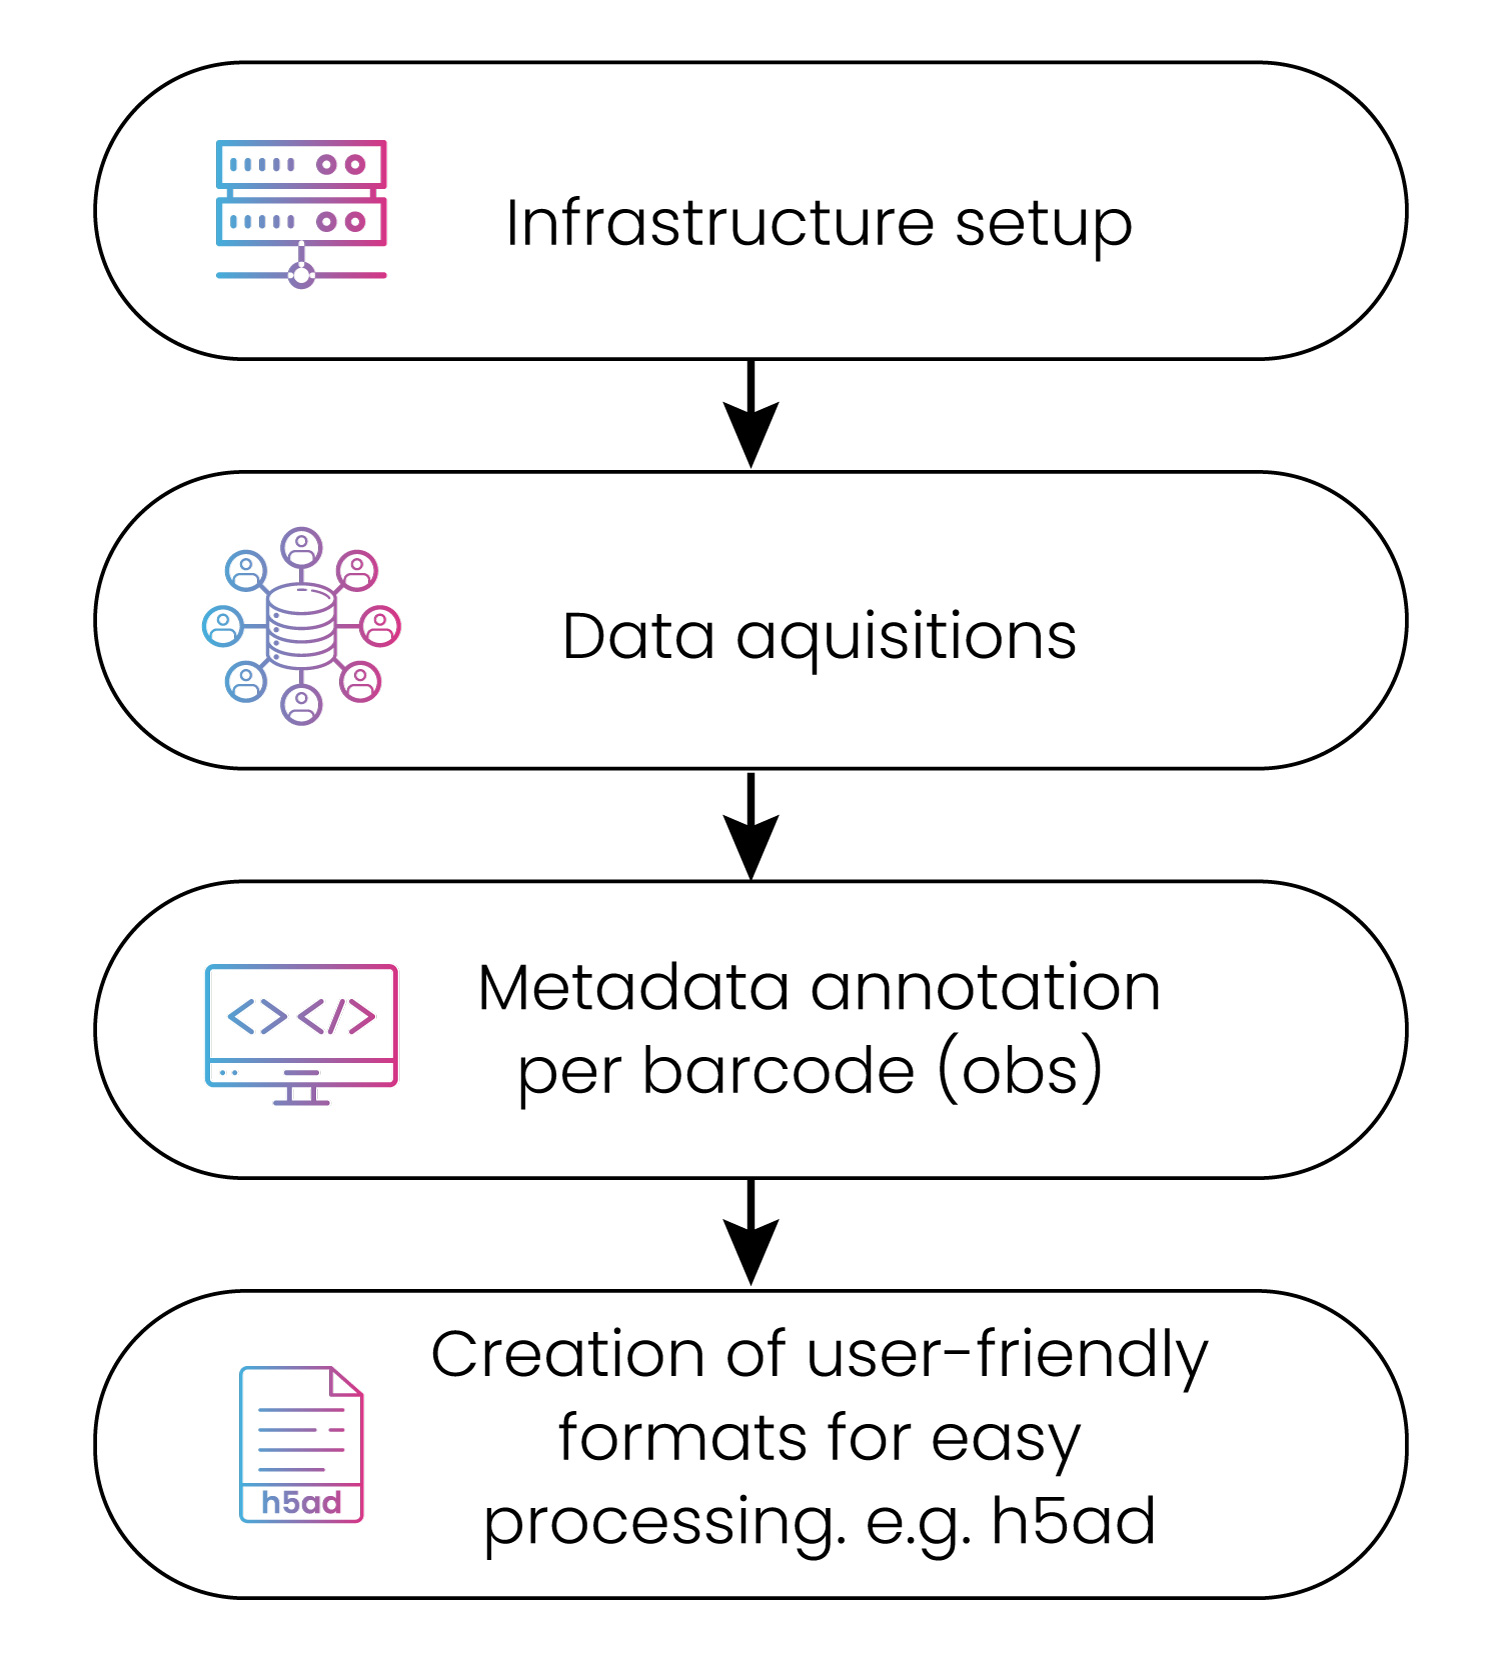
Figure 2: The data download and curation process
Data collation, curation, and conversion
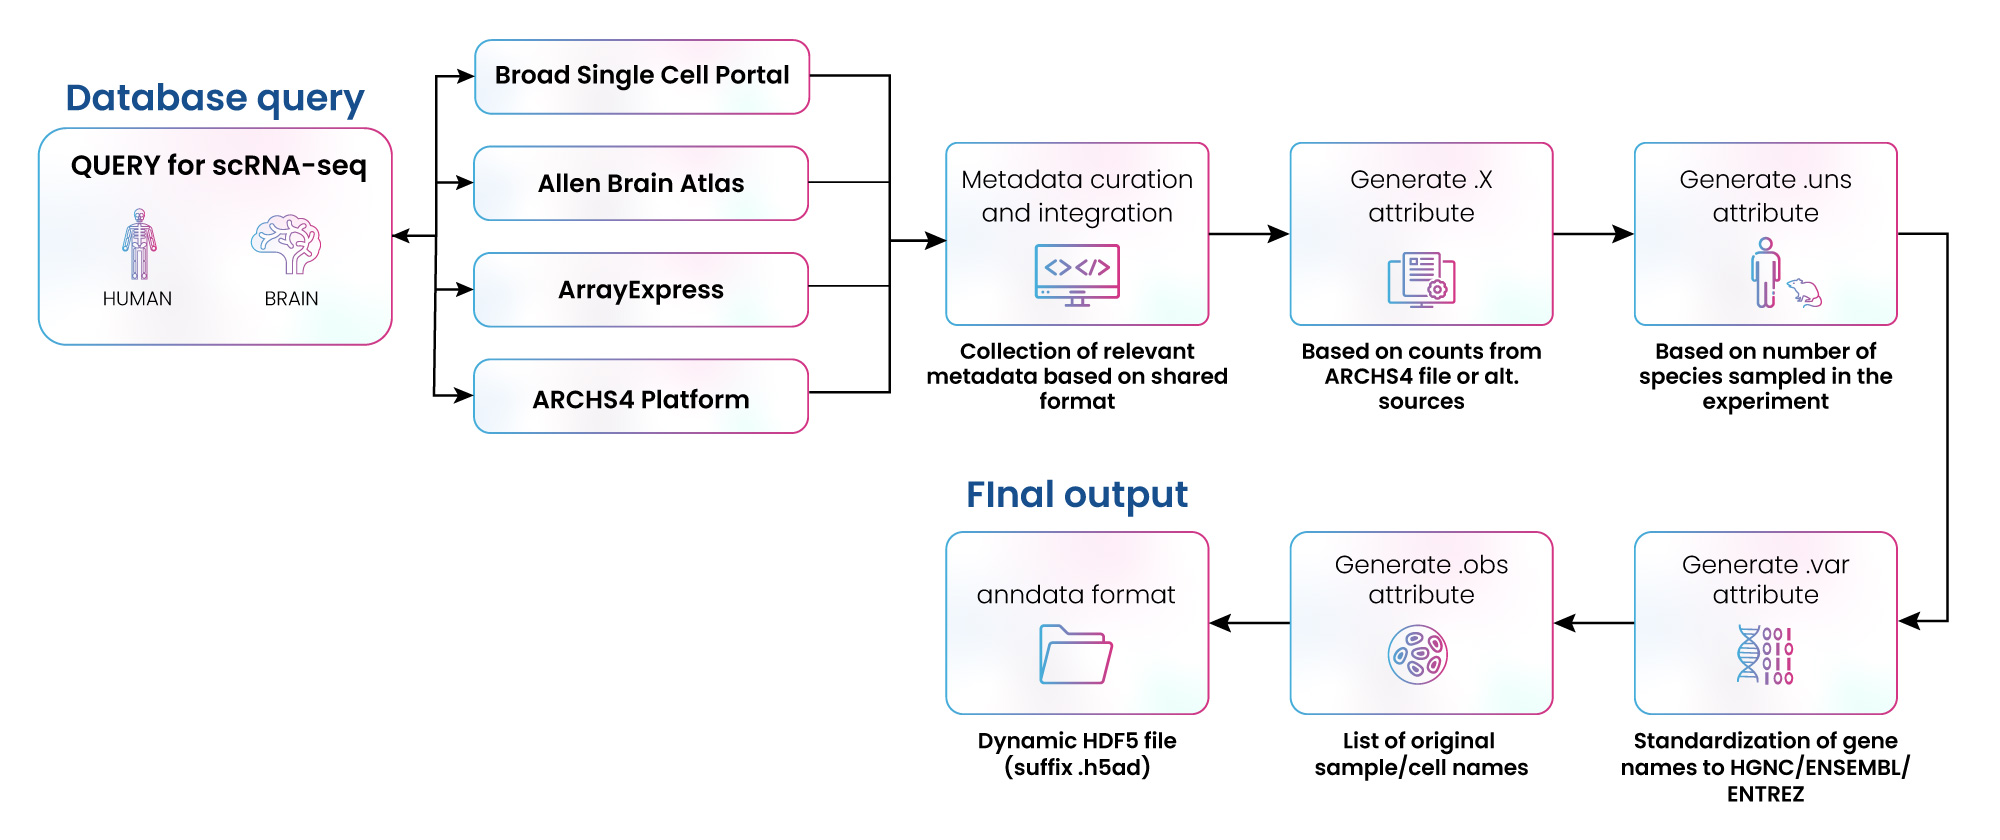
Figure 3: Curation of scRNA-Seq data from multiple repositories
We have extensive experience collating and curating data from multiple repositories. For example, we were engaged by a client to collect scRNA-seq data from four different sources: Broad Single Cell Portal, Allen Brain Atlas, ArrayExpress, and ARCHS4. The data was converted to .hdf5 format, then curated, annotated, and formatted to be utilized in multiple scRNA-seq experiments (fig. 3). Over 400,000 data samples were integrated using this approach (fig. 4). In a parallel effort, the GEO database was also queried, covering 84,356 sample accession numbers (GSM) IDs from 360 gene expression data series (GSEs).
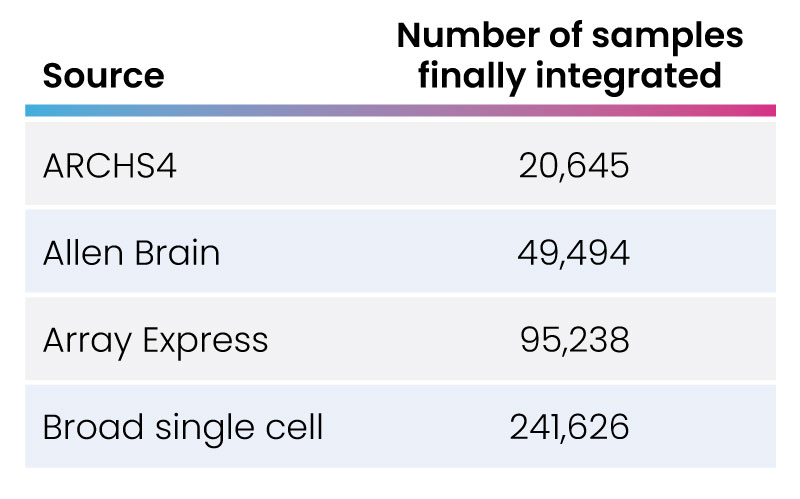
Fig 4: Number of samples integrated from various sources.
In another successful annotation and harmonization project, we collated and annotated an extensive collection of metadata before converting it from a variety of source formats (.10x, .rds, .mtx, .csv) to a scanpy-compatible format for further processing,
Excelra’s scRNA-seq pipeline development
Comprehensive analysis of scRNA-seq data demands collaboration and communication between state-of-the-art algorithms and analysis packages. Bench scientists must be able to use both technologies in harmony, retaining the ability to scale at pace without relinquishing economic viability. This can be accomplished by adherence to a strategic process that moves efficiently through three stages: generation of the count matrix, analysis of the count matrix, and data visualization (fig. 6).
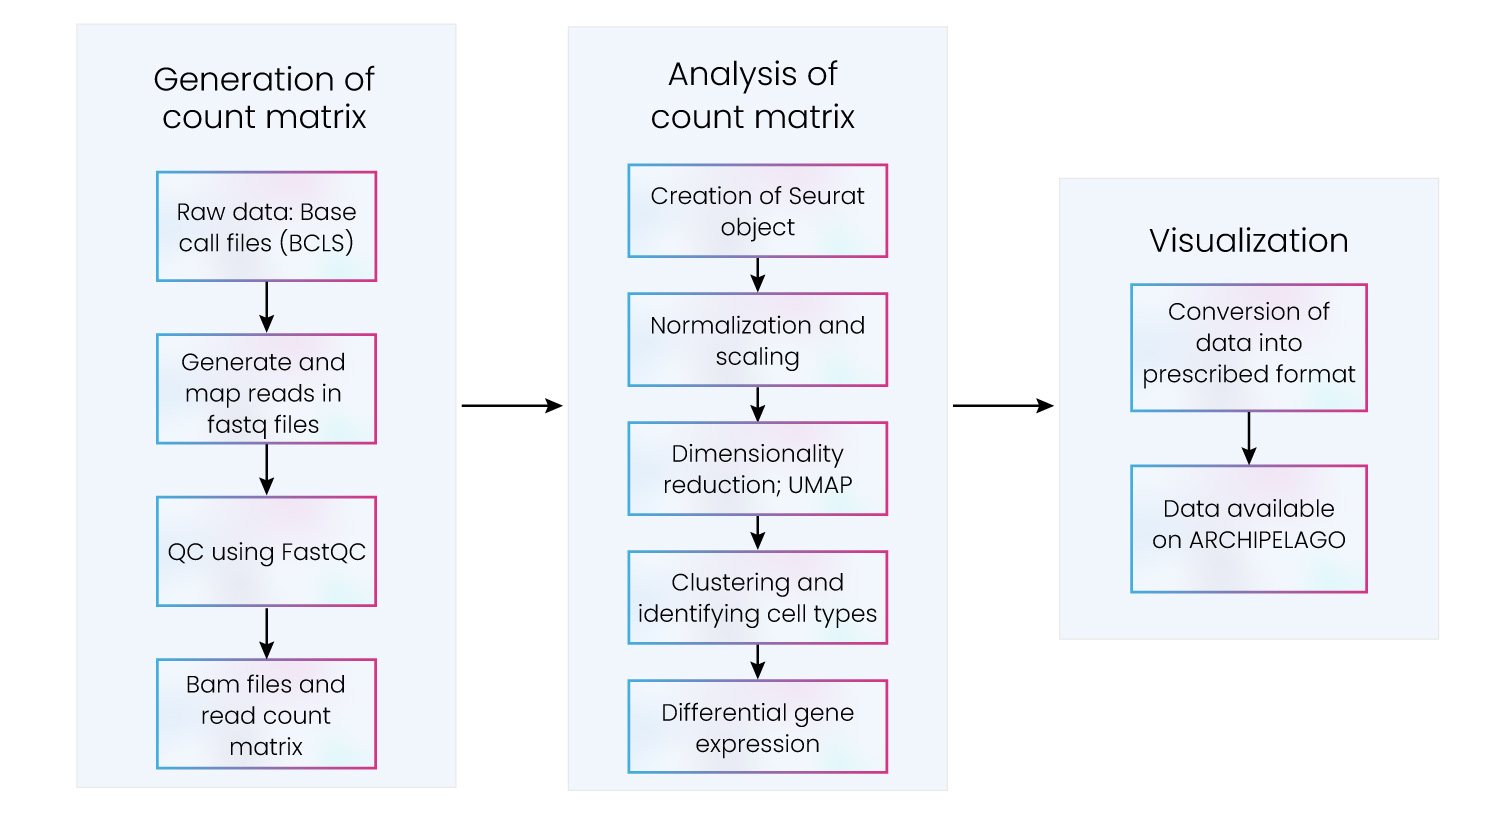
Figure 6: Key steps in scRNA-seq data processing and downstream analysis
Excelra delivers containerized, deployable, and scalable data analysis pipelines that smoothly and effectively move through these stages. Our scRNA-seq pipeline efficiently allocates resources to ensure scRNA-seq data analysis programs are delivered on time and within budget.
Our pipeline exploits the best features of Seurat, Cell Ranger, and Loupe, integrating them seamlessly. This combination helps clients complete multiple analysis processes with speed and agility.
We have also designed, developed, and deployed a scRNA-seq analysis read-to-count pipeline that parallelizes the scRNA-seq read-to-count workflow for SmartSeq2 and 10x Cell Ranger technology. Our read-to-count pipeline includes a powerful user interface to simplify pipeline-run-related metadata monitoring (fig. 8).
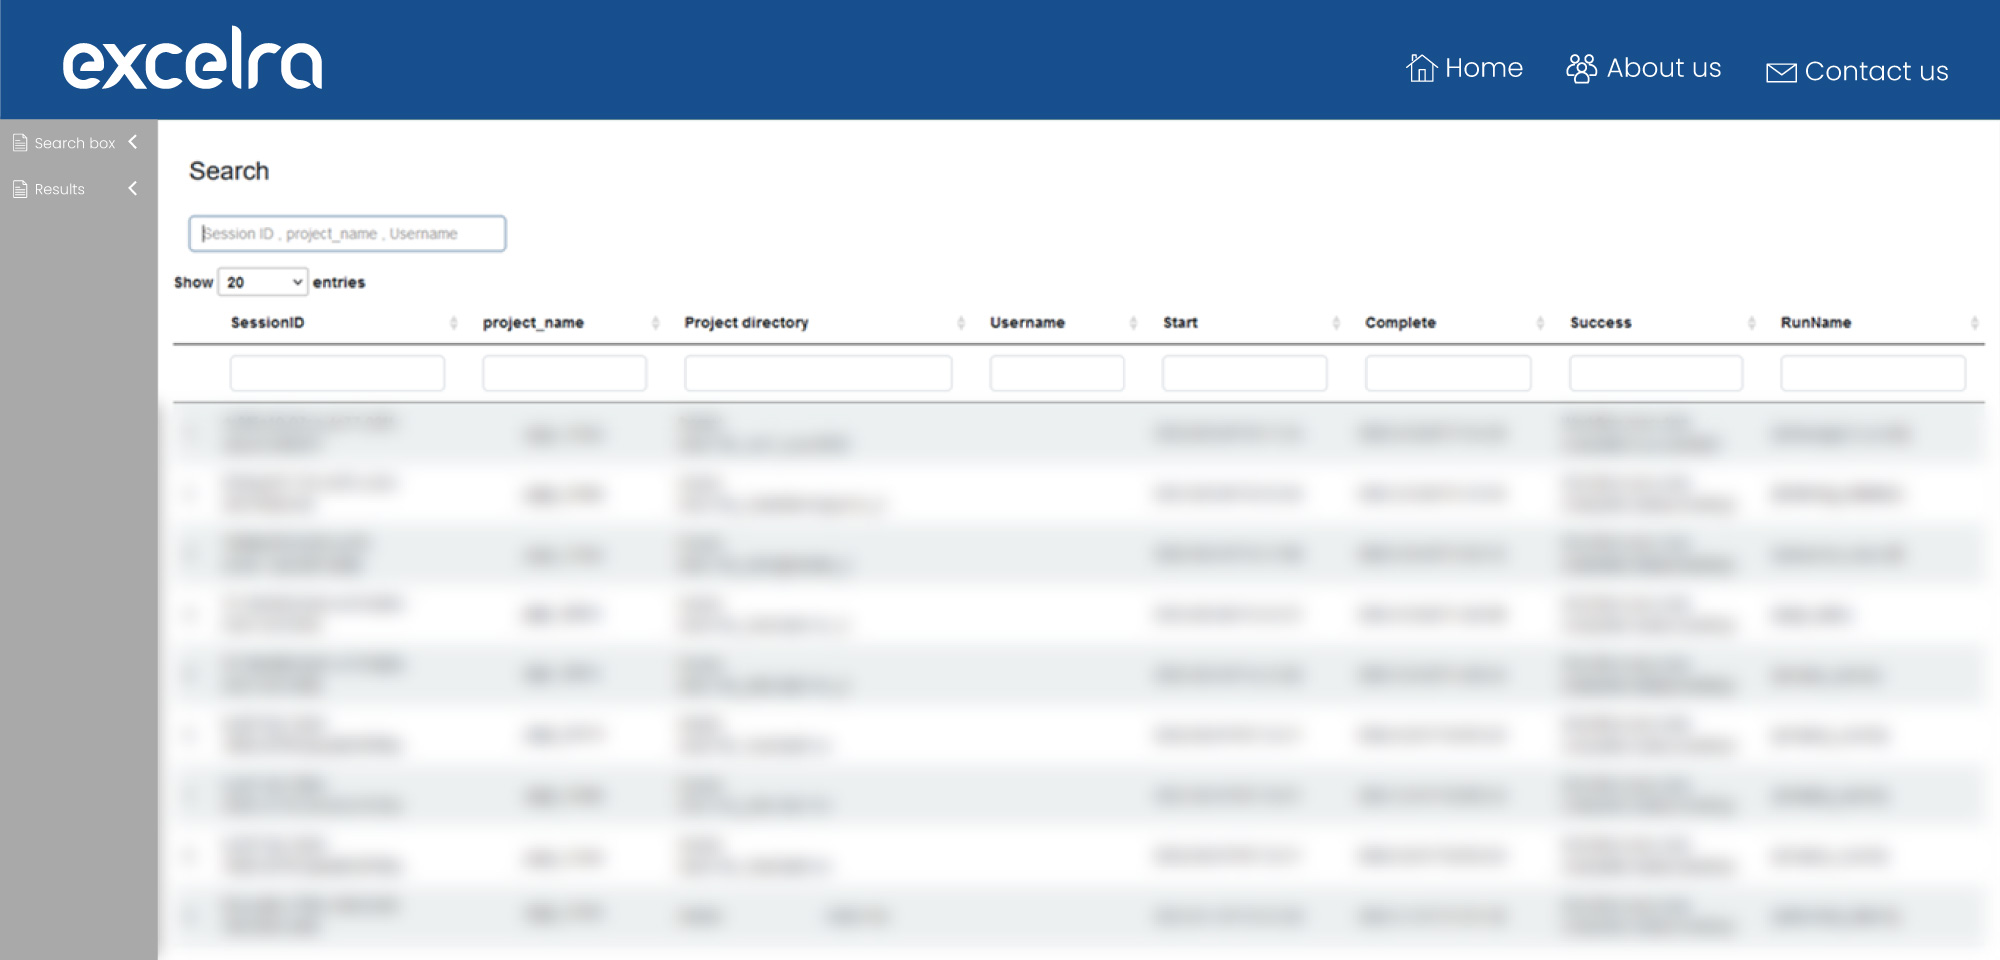
Figure 8: scRNA-seq analysis pipeline with UI
Pipeline solutions have been widely accepted, but many are still in early development and require further improvement and strategic introduction of features. Maintaining standards while reducing costs and increasing speed has proven difficult for many suppliers. Excelra’s pipelines are already at an advanced stage, and our strategic curation and quality validation ensure result accuracy remains paramount without compromising on cost, efficiency, or accessibility.
Key features of Excelra’s scRNA-seq data analysis pipeline:
- Ability to execute particular code versions from a git repository
- Programmable e-mail notifications following analysis completion or error discovery
- Archiving and output tools for auditing and security
- Automatic resource selection (CPU, GPU, RAM, etc.) for each process, based on the requirements of the input files
Excelra’s scRNA-seq data analysis experience
- Deconvolution of bulk RNA-seq data
- Differential expression analysis
- RNA velocity analysis
Approaches to scRNA-seq data analysis vary substantially in the type of results they produce, the speed at which they operate, and their cost. The ability to study one individual cell at a time has been warmly welcomed by researchers, and has generated much excitement in the scientific community. It has also led to the rapid development of competing analysis protocols and solutions. Before undertaking a data analysis project, serious consideration should be given before choosing the specific approaches to suit your analysis priorities.
We’re confident that our workflows will help you meet your objectives. Our interdisciplinary team of scientists and technologists curate analysis workflows precisely suited to your requirements. We’ve successfully supported some of the most prominent companies working in this field, who appreciate our knowledge of repositories and file types, our capabilities with many platforms and methodological frameworks, and our meticulous attention to detail.
We’ve developed our capabilities strategically over many projects. We’ve learned that the most effective pipelines must only be designed following thorough investigation and understanding of your requirements and existing infrastructure. We survey the landscape of available tools and packages, benchmarking and comparing to help you choose the right approach for your project. Once we have all this information, we proceed to design and development (Fig 9).
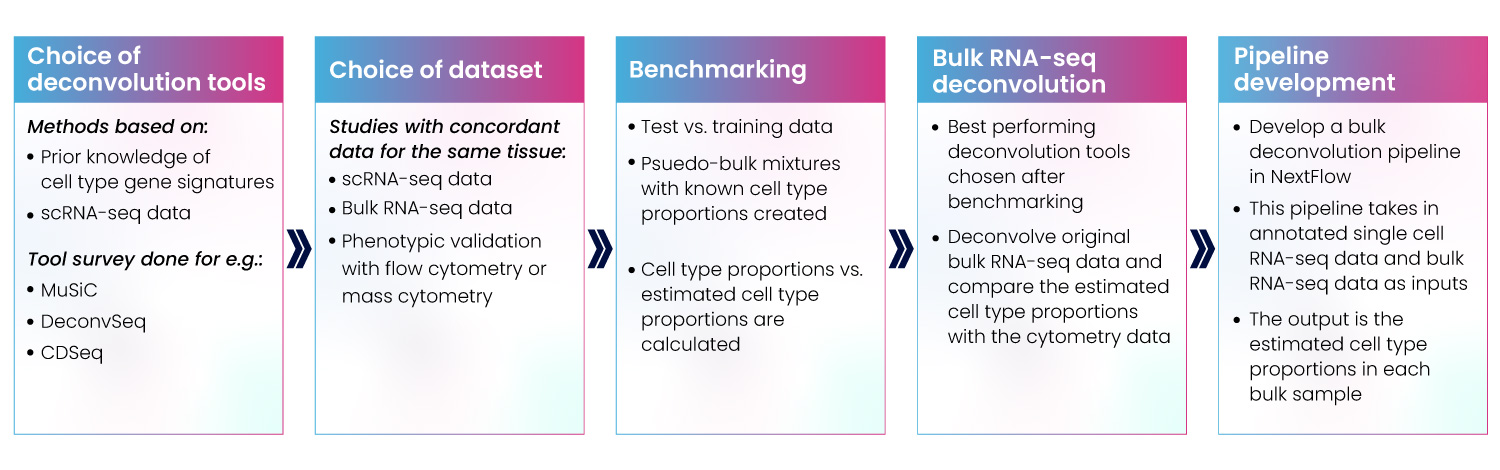
Figure 9: Development of bulk RNA-seq deconvolution pipeline
Effective and meaningful pipeline outputs
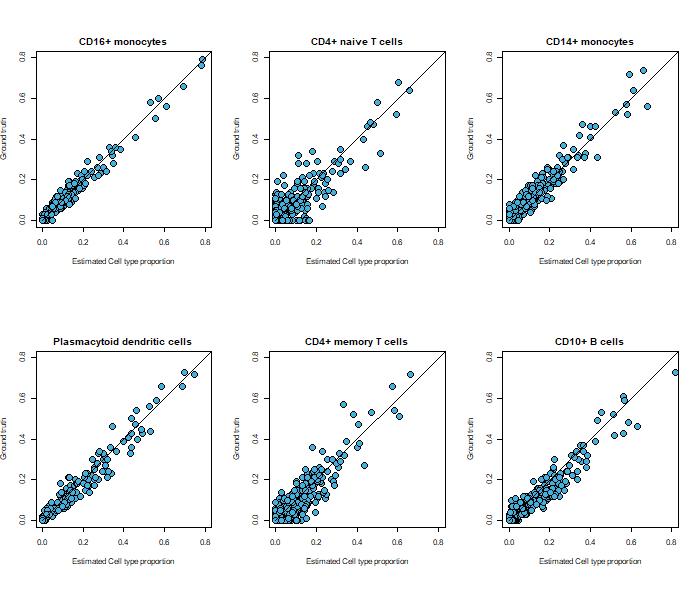
Fig 10: Bulk RNA-seq deconvolution using Excelra’s scRNA-seq pipeline
A pipeline can only be considered effective if the value can be derived from its output. Our outputs are designed to ensure researchers receive the information they need, unpolluted by noise or unnecessary distractions.
The image shows scRNA-seq and bulk RNA-seq data from human bone marrow (fig. 10).
In this example, the pseudo-bulk mixtures created from the scRNA-seq data were deconvolved using MuSiC[ii].
The plot shows the relationship between the known and estimated cell-type proportions by MuSiC.
We have also developed workflows for RNA velocity analysis and differential expression analysis. The RNA velocity pipeline has been created for 10x and Smart-seq2 data and predicts the future transcriptional state of cells.
For differential analysis, our pipeline provides end-to-end analysis workflow for scRNA-seq data (fig. 11).
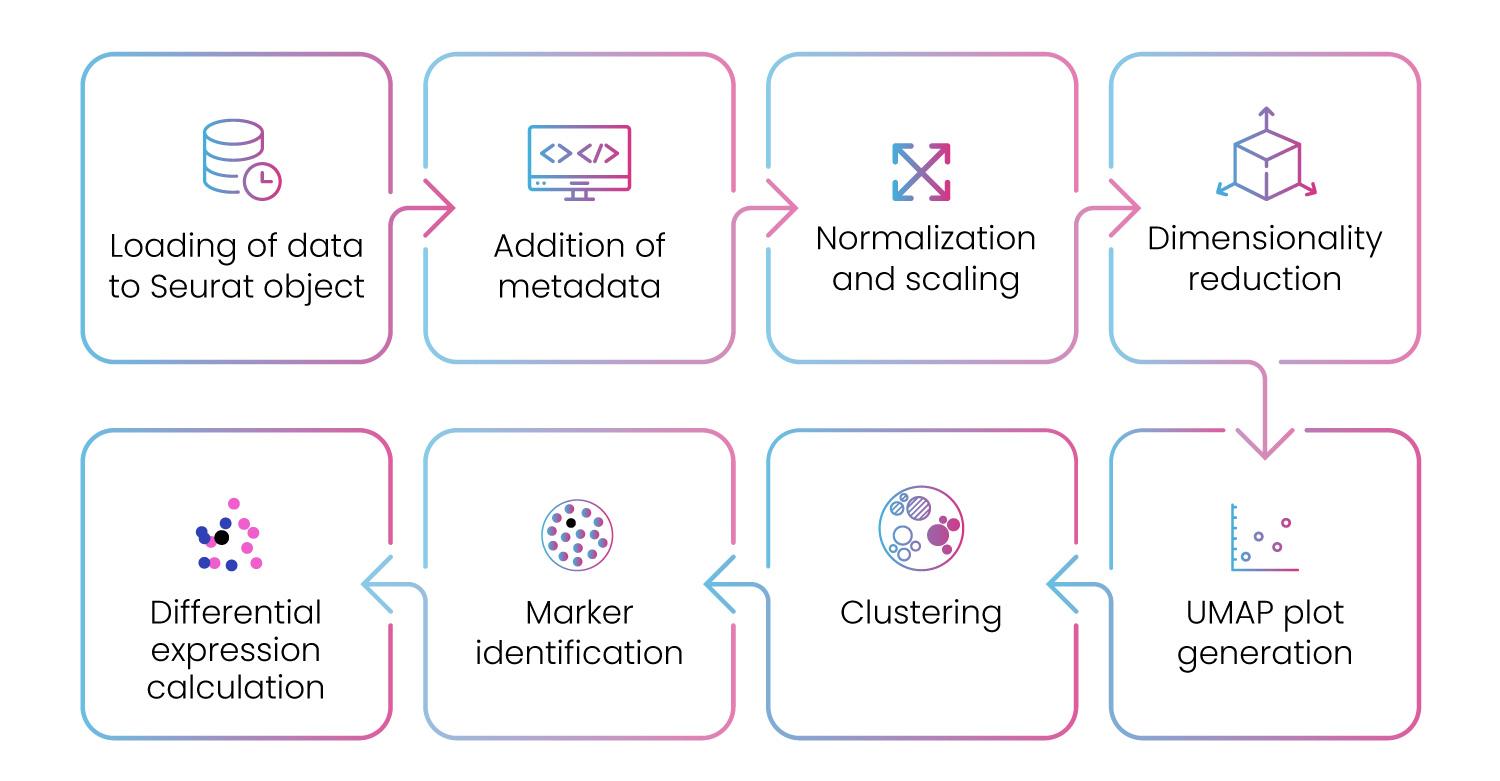
Figure 11: Differential gene expression pipeline to analyze scRNA-seq data
We provide strategic solutions to various scRNA-seq data analysis requirements, specializing in providing custom solutions for data analysis, dataset curation, visualization, and pipeline development.
Excelra’s scRNA-seq data visualization capabilities
To accurately interpret single-cell data, researchers need to visualize and interact with the data from one cell at a time. The high dimensionality of scRNA-Seq data points requires accurate plotting against and overlaying of associated metadata. Visualization tools, therefore, play a vital role in the analysis process.
Data visualization tools help researchers engage and communicate analysis results. Many tools and packages exist in this space that address most of the primary requirements of research programs, and after many iterations, the most popular solutions have reached effective maturity. However, there is still no scalable, easily accessible tool that can ingest data from multiple sources, display statistically significant results sorted for biological inferences, and allow quick and intuitive navigation through a customizable UI.
To meet the demand for such a tool, we’ve developed our own single-cell sequencing analytical platform, capable of robust statistical analysis and engaging data visualization (fig. 12).
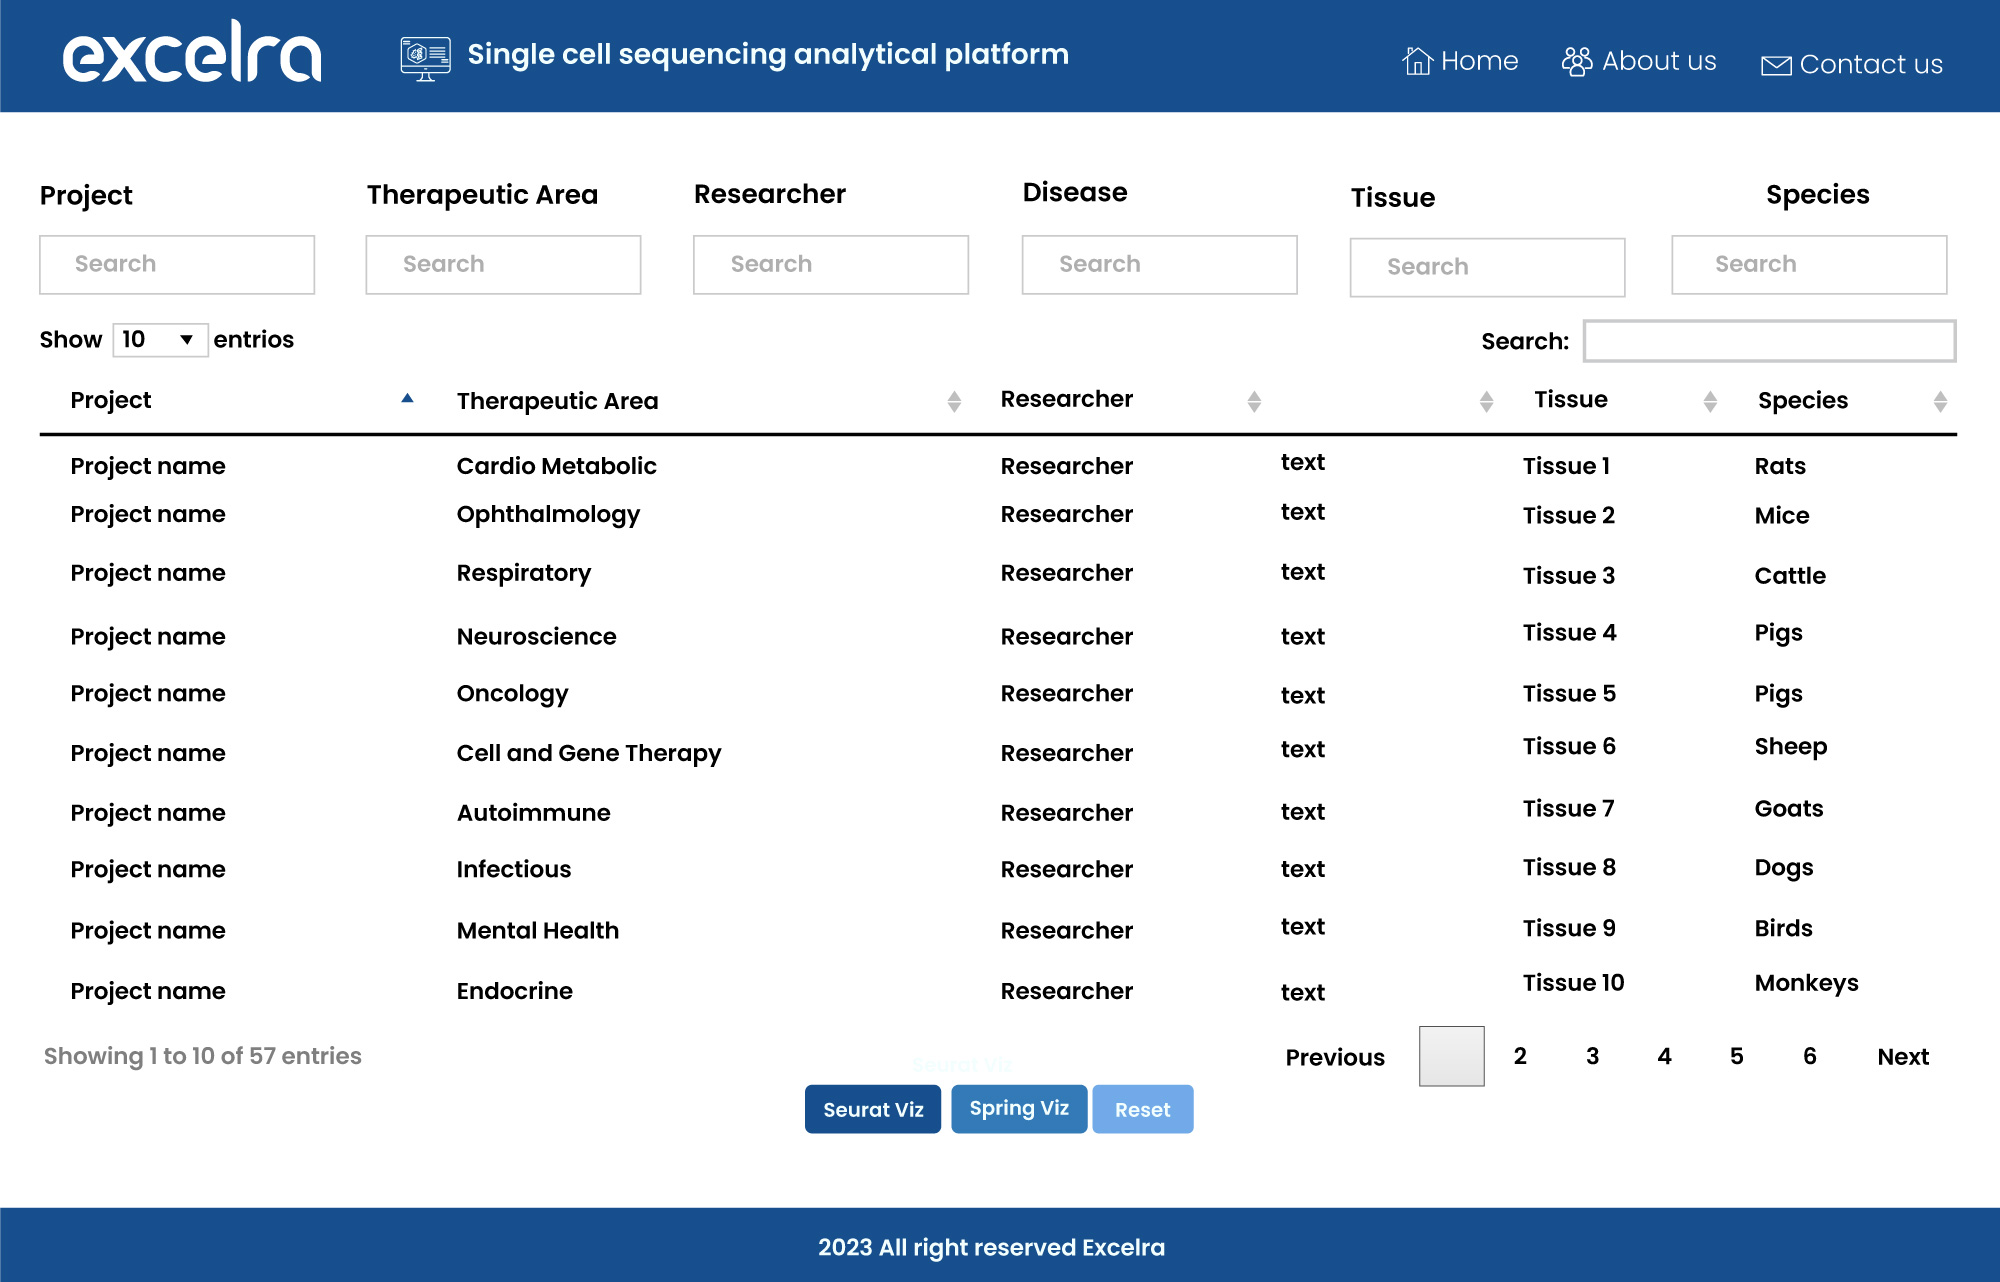
Figure 12: Single-cell sequencing analytical platform for scRNA-seq data analysis and visualization
Available visualizations:
a. Single-cell cluster analysis
This view helps the end user select a biologically relevant resolution or k from clustering results by assessing differential expression between the resulting clusters.
b. Gene expression analysis
This view helps to analyze expressions of a single gene across multiple conditions or cell lines.
c. Violin plots
These plots allow allelic frequency comparison, capturing variability across cell lines for the selected gene pair.
d. Force-directed layouts
These graphs display k-nearest-neighbor, presenting continuous gene expression topologies in a manner that preserves high-dimensional relationships and captures complex population topologies.
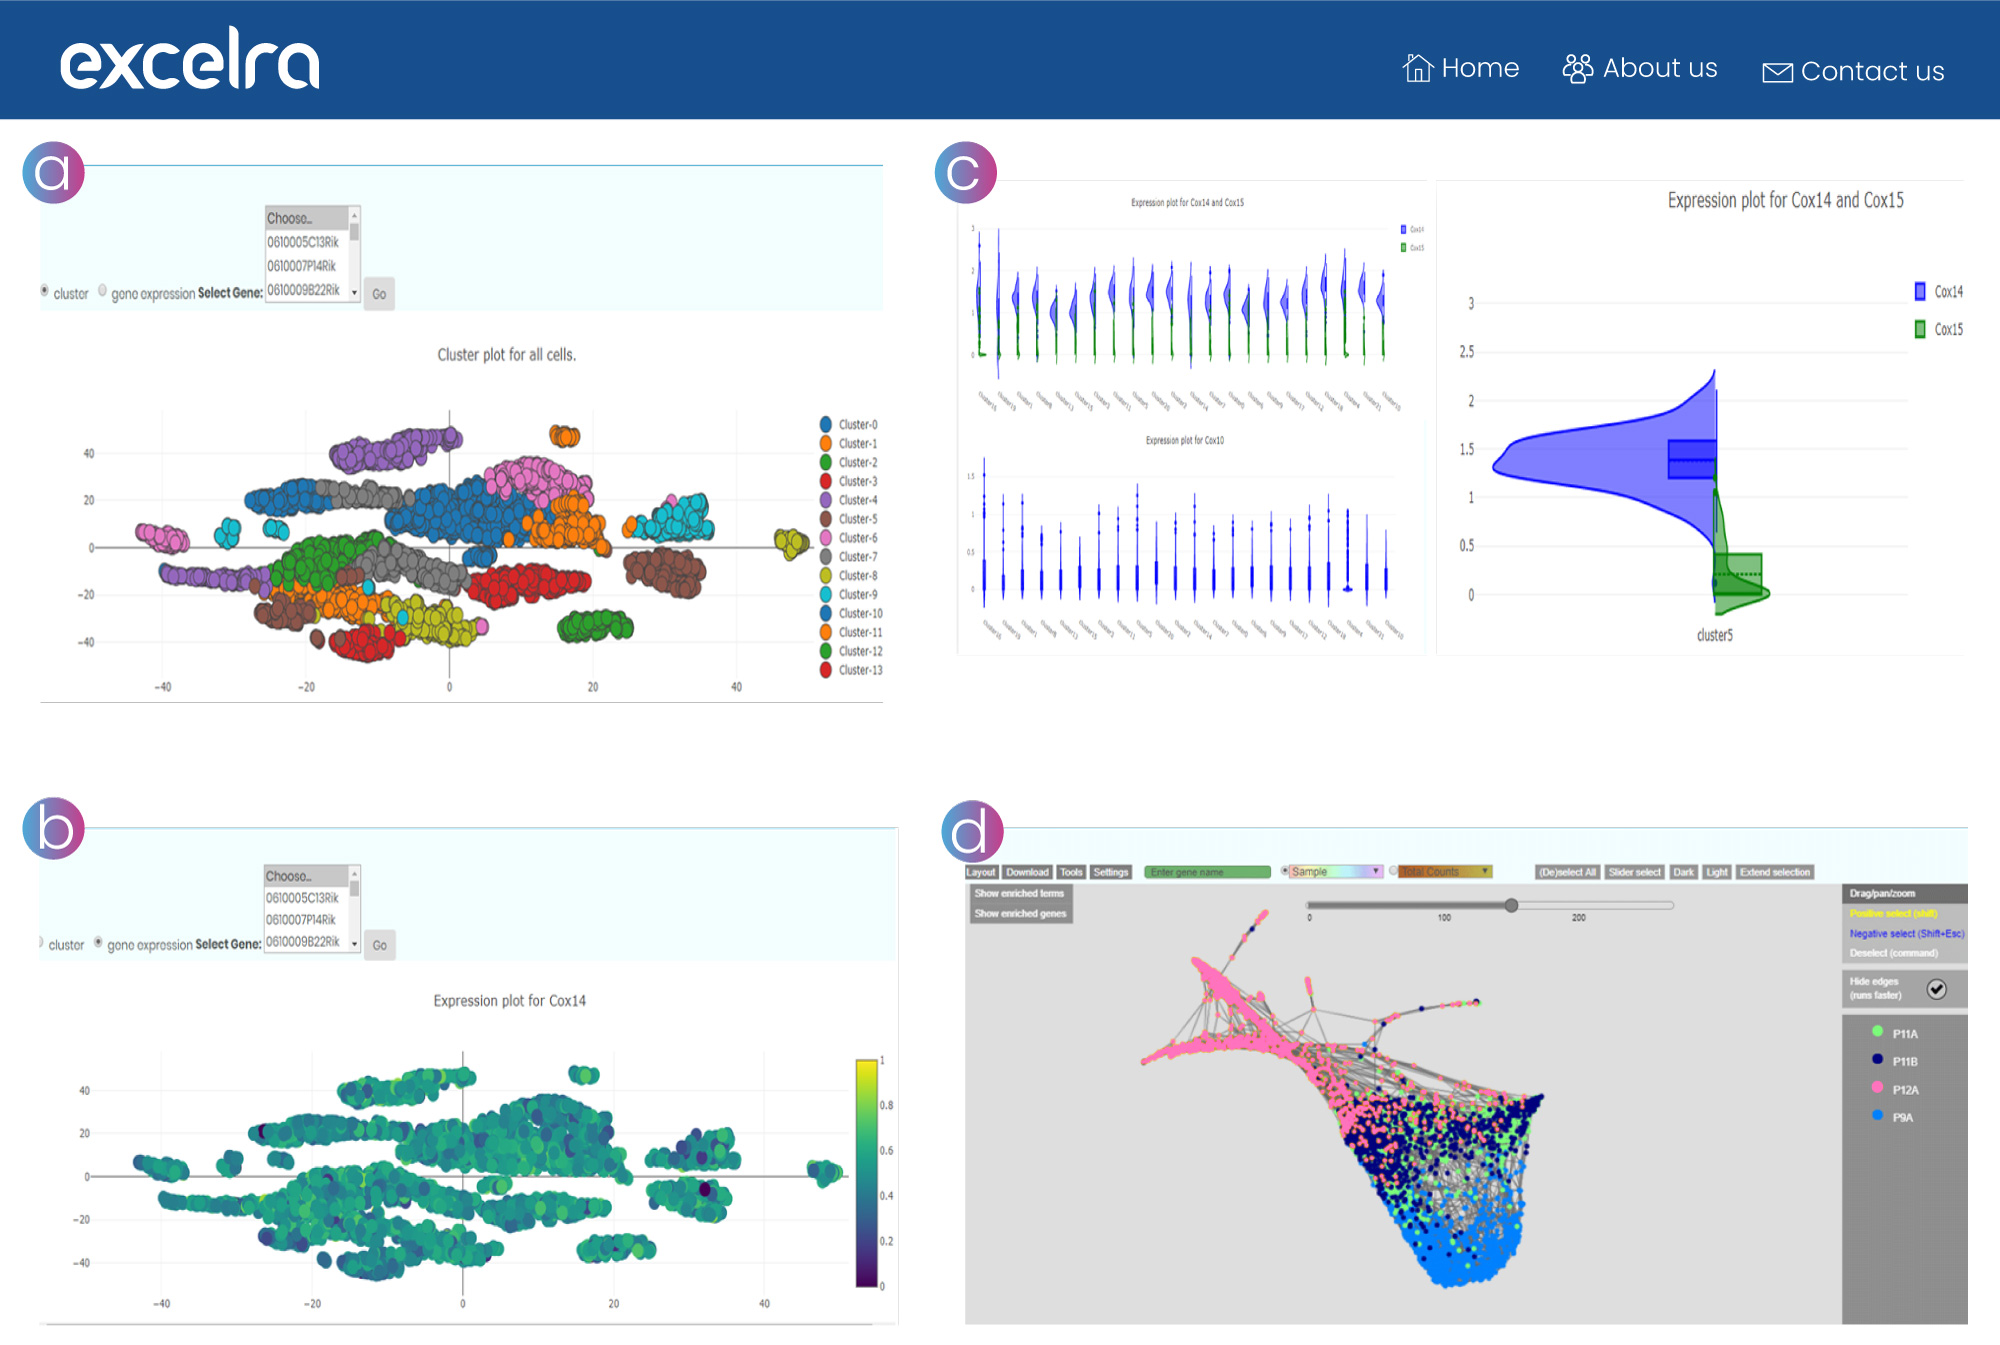
Figure 13: a.) Single-cell cluster analysis. b.) Gene expression analysis plots. c.) Violin plots. d.) Force-directed layouts of k-nearest-neighbor graphs
Key features of Excelra’s single-cell sequencing analytical platform:
- Available data sets are immediately accessible from the home page. Public and in-house datasets are listed to enable rapid examination and interpretation.
- Each data set includes a summary of the corresponding study.
- Visuals are presented in a single click from the data set overview page.
- The tool is built in R Shiny, Java, and MongoDB, ensuring maximum compatibility with your infrastructure.
Excelra also offers scRNA-seq data visualization capabilities via browser. Here, users can select a single-cell dataset and plot UMAP visualization, color the data points based on metadata or gene expression. They can also create dot plots or heatmaps for gene expression and plot cell abundance per metadata factor (fig. 14).
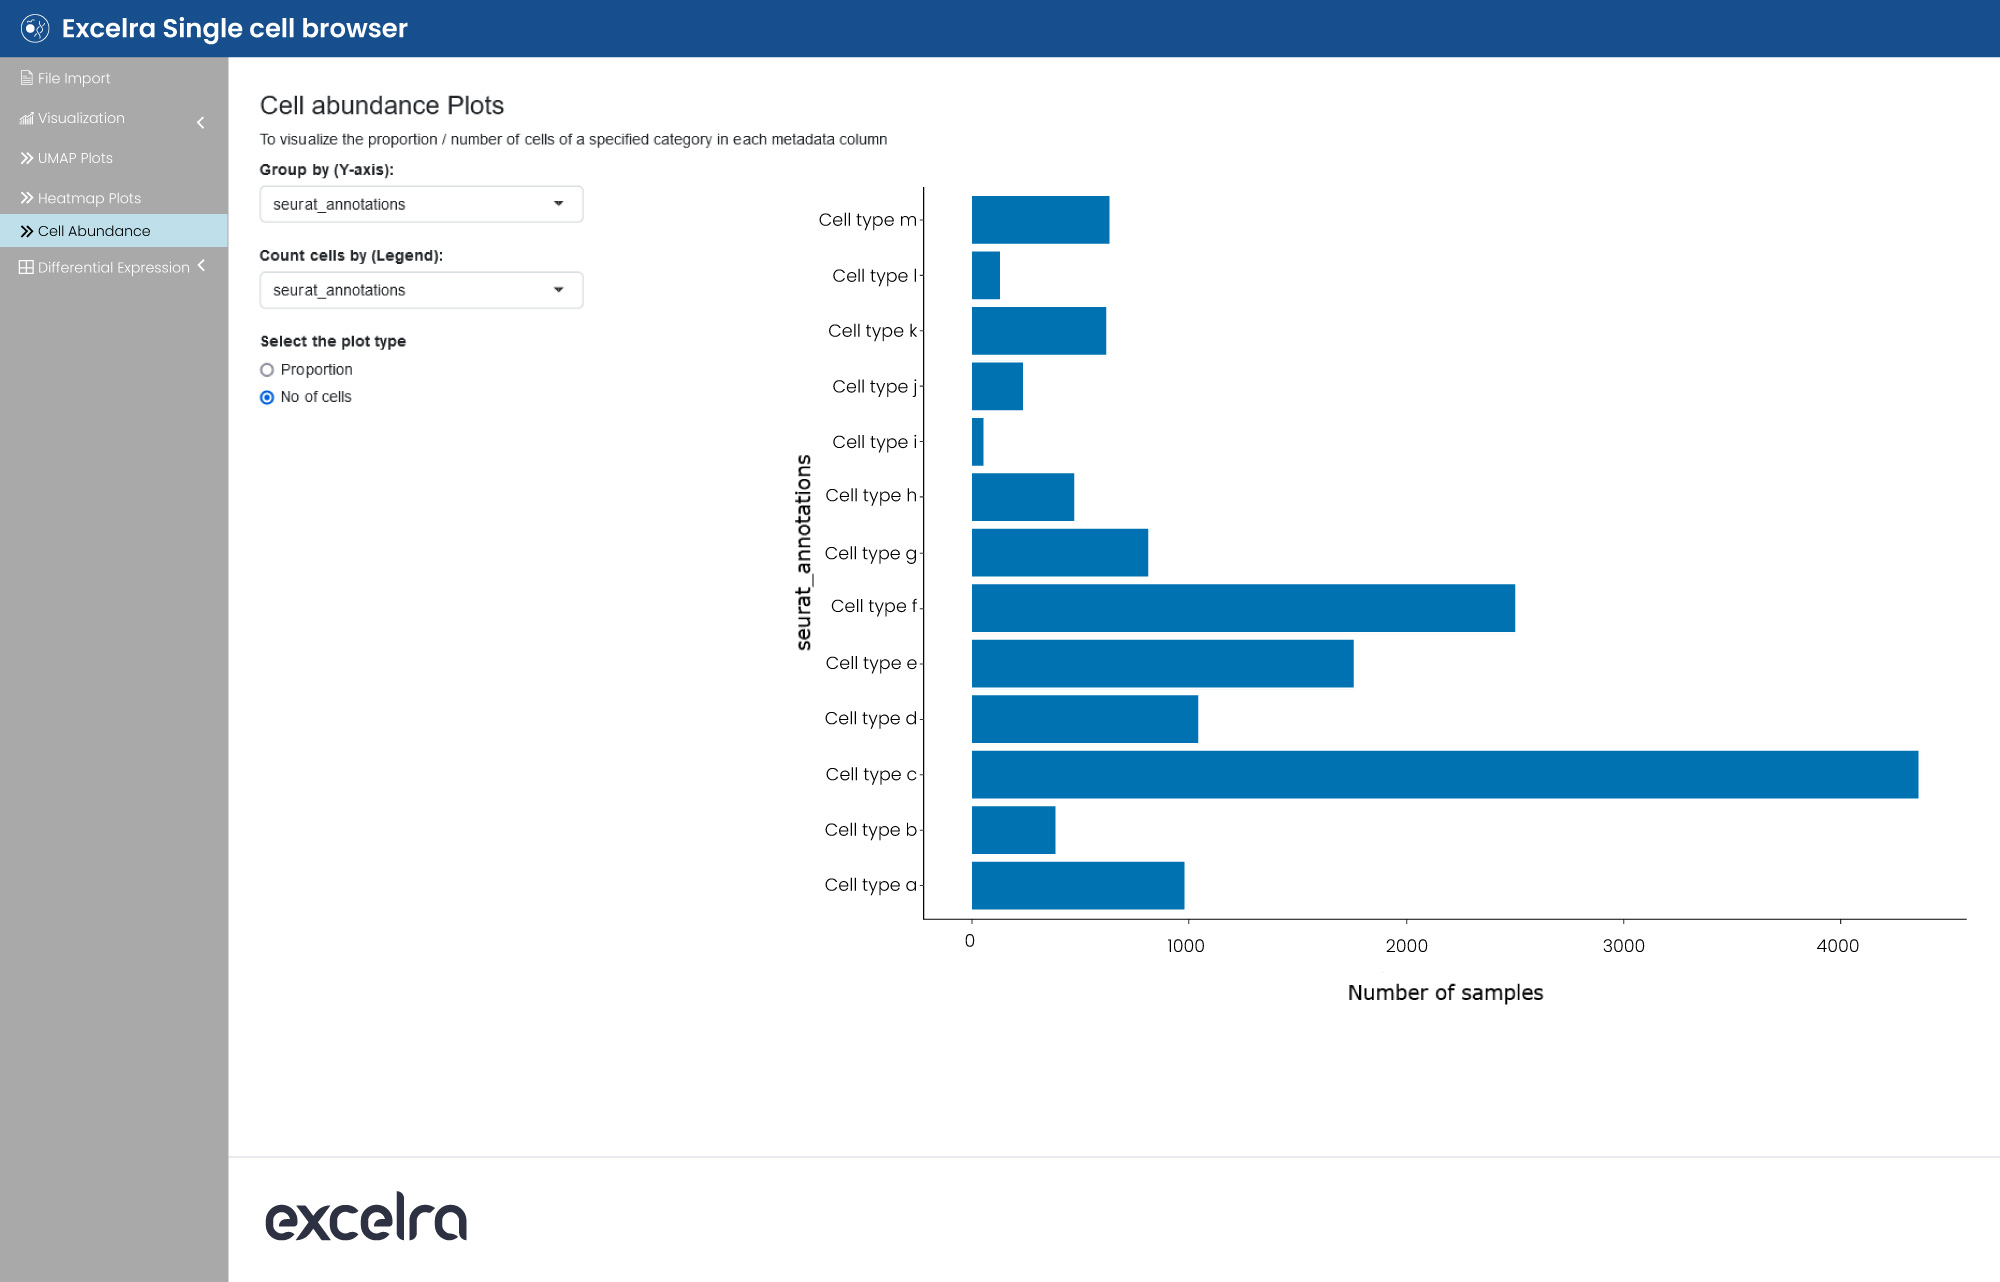
Figure 14: An analysis of cell abundance
The web application allows differential analysis, enabling cell type-specific and pairwise comparisons (fig. 15). The list of differentially expressed genes is displayed in table format to facilitate straightforward interpretation.
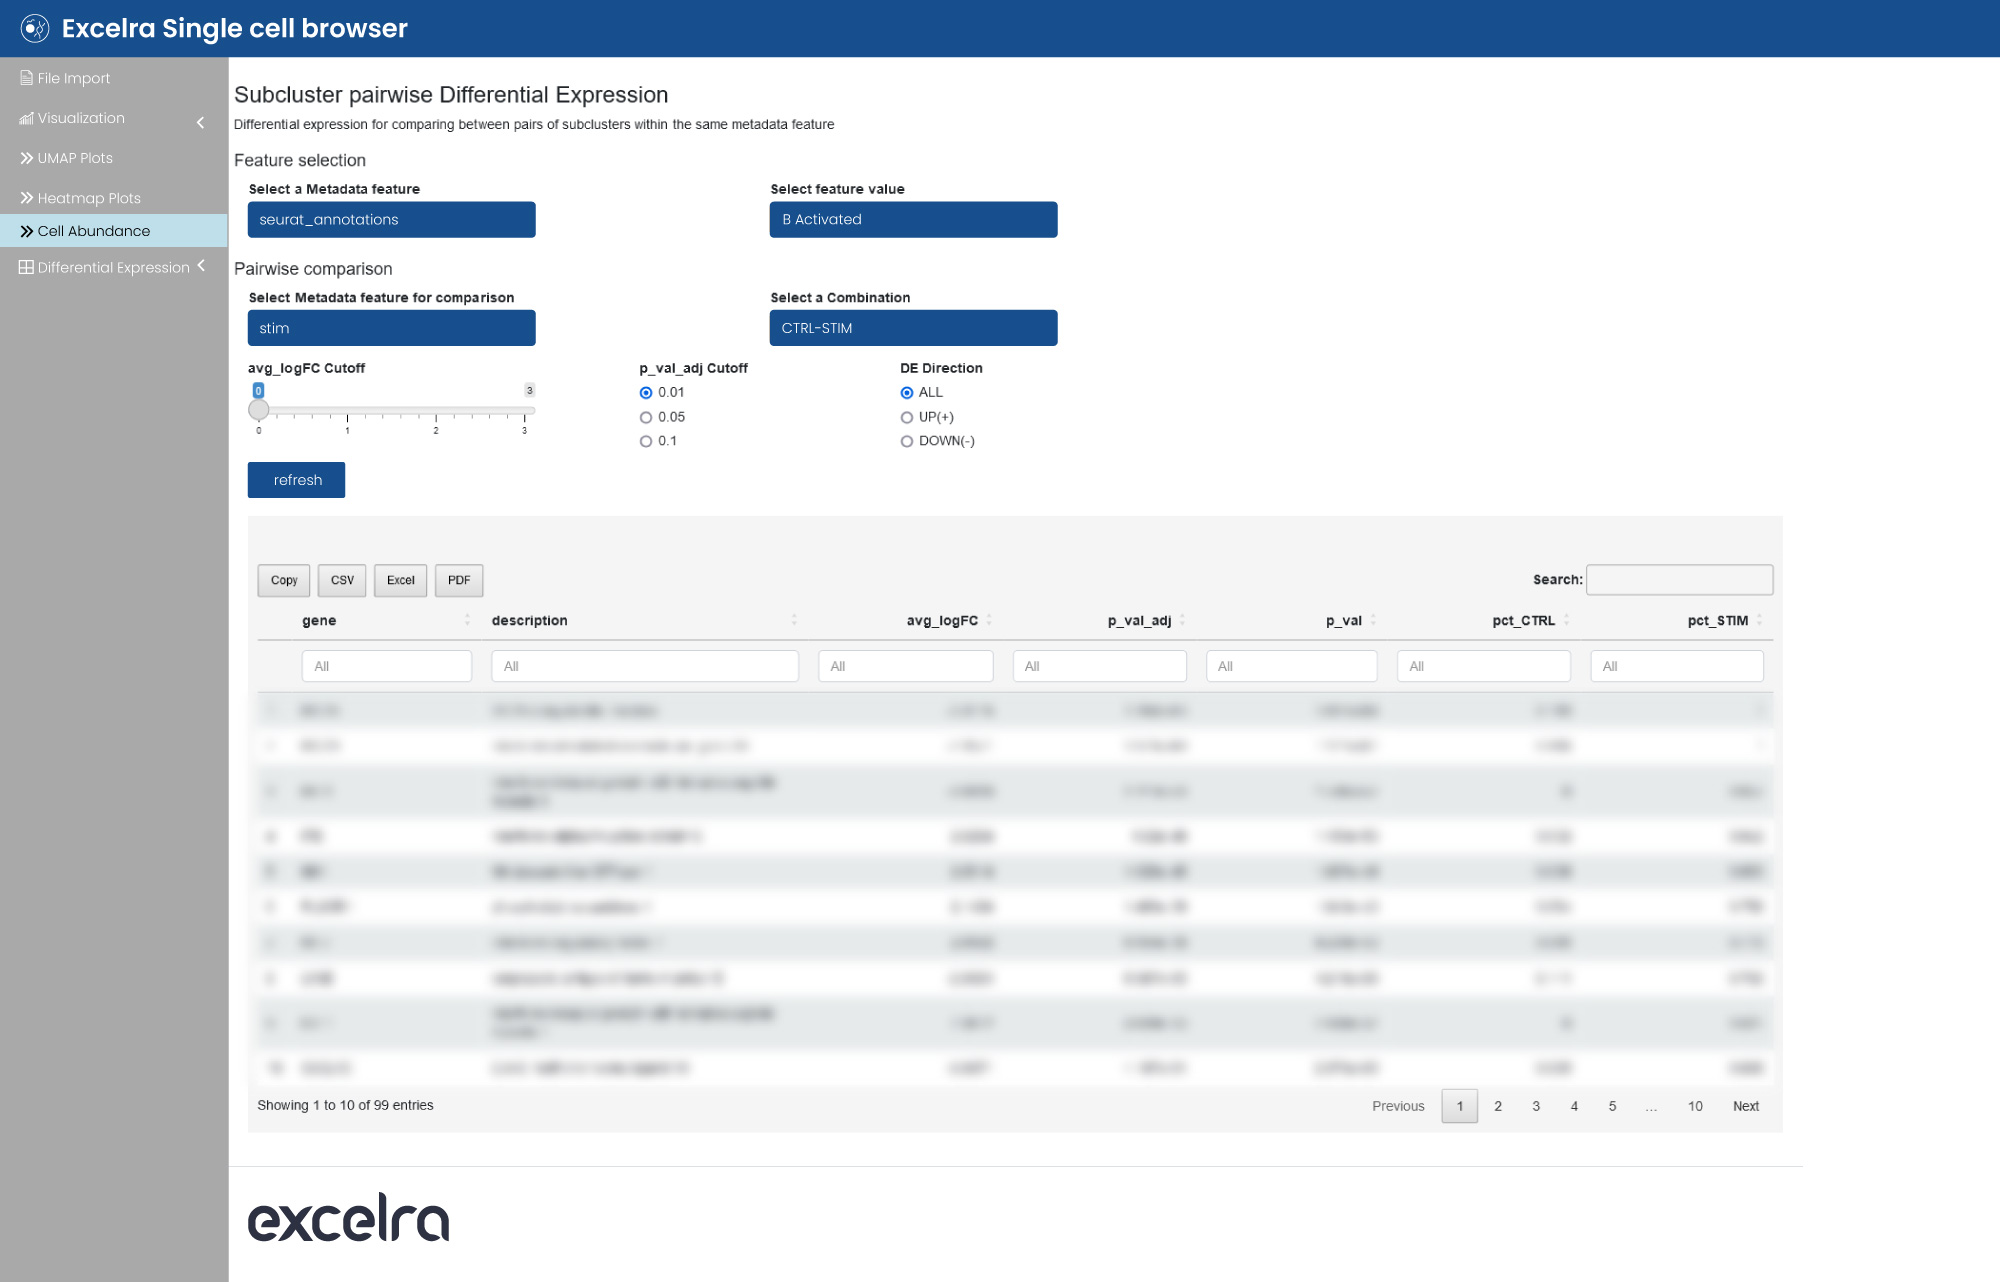
Figure 15: Differential expression analysis of scRNA-seq data
Excelra’s strategy for maximizing the potential of scRNA-seq analysis
Single-cell RNA sequencing has dramatically enhanced the available avenues of bioinformatics research areas, including cancer and immunology. Significant progress has been made in deciphering single-cell genetic characteristics, and the approach has been combined with bulk RNA sequencing, flow cytometry, CRISPR, and other techniques to amplify research opportunities and scale analysis processes.
Single-cell data has been successfully employed to deconvolute existing bulk RNA-seq data, which helps researchers understand cell-specific contributions to global gene expression changes. Tumor necrosis factors can also be studied by combining scRNA-seq data alongside flow cytometry. By adding spatial transcriptomics information, researchers can explore spatial tissue organization.
The impact of single-cell RNA sequencing on scientific endeavors can’t be overestimated. It has transformed many areas of study, including cell lineage, RNA Velocity, biodistribution, and the cellular response of transfected genes. It has led to the creation of cell atlases and the identification of rare and novel cells. The research it has made possible has the potential to illuminate our understanding of cell development and potentially contribute to major breakthroughs in drug discovery and development.
However the field of scRNA-seq grows, Excelra will grow with it. We will continue applying our data expertise to support our clients’ objectives. Our strategic analysis workflows and powerful visualization tools provide the reliability, efficiency, and scalability required by R&D teams engaged in single-cell RNA sequencing projects.
We have over 500 scientists delivering a comprehensive portfolio of bioinformatic services. Alongside scRNA-seq, RNA-seq, and DNA-seq analysis, we develop metabolomic and proteomic analysis pipelines. We also provide database curation, target identification, and target dossier services.
We have extensive experience building data analytics solutions that help our clients scale their work in the infrastructure of their choice. Our omics data-analysis pipelines are built for platforms like DNAnexus and Seven Bridges, or deployed directly on AWS, Azure, or GCP. We use Nextflow or Snakemake for job scheduling and configuring high-volume data processing. And for your next scRNA-seq project, we have the agility and ability to provide comprehensive, scalable, and affordable solutions to meet your exact requirements and existing systems.
We’re ready to contribute to your next research breakthrough. To find out how our services can help you achieve your scRNA-seq objectives, contact our bioinformatics experts.
References:
- [i] Tang, F., Barbacioru, C., Wang, Y., Nordman, E., Lee, C., Xu, N., Wang, X., Bodeau, J., Tuch, B. B., Siddiqui, A., Lao, K., & Surani, M. A. (2009). mRNA-Seq whole-transcriptome analysis of a single cell. Nature Methods, 6(5), 377–382. https://doi.org/10.1038/nmeth.1315
- [ii] MuSiC: Multi-subject Single-cell Deconvolution. (n.d.). https://xuranw.github.io/MuSiC/articles/MuSiC.html
Ready to get more from data?
Tell us about your objectives. We’ll help get you there.
"*" indicates required fields