Quickly and easily access all information that came out of the analysis of your single-cell transcriptomics data sets.
Single-cell transcriptomics is revolutionizing our understanding of the diversity of cells, their changes over time and under various conditions. Our customers often ask us to analyze their single-cell transcriptomics data and answer a specific set of questions. However, the analyzed object contains much more information, and leaving it at this one-time analysis would be a huge waste. Especially that collecting and processing single-cell samples is incredibly expensive.
Therefore, for this data to become a real asset, it has to remain accessible to scientists and analysts, so that it continues to serve as a reference compendium as projects evolve or new findings on the topic are published.
Do you need help with the analysis of your single-cell transcriptomics data?
Easy access to and visualization of your single-cell transcriptomics data sets
With our Single Cell Browser, we enable our customers to quickly and easily access all information that came out of the analysis of their single-cell transcriptomics data sets.
The user-friendly interface assures that users don’t need any programming skills to select and visualize relevant data. The plots and data representations are fully customizable to facilitate further sharing of the results with stakeholders and various audiences.
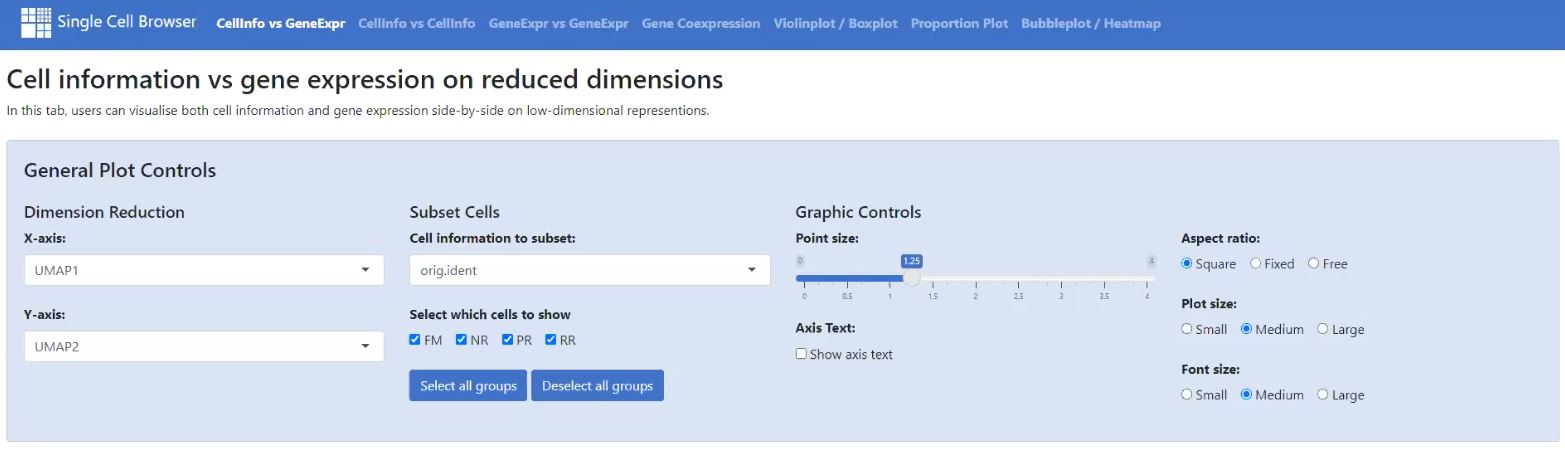
In General Plot Controls you can for example: decide on the dimension reduction, select which subset of cells to display, choose plot type (for example, Violin vs Boxplot, Proportion vs Cell numbers) and adjust various parameters for graphics representation – click to enlarge
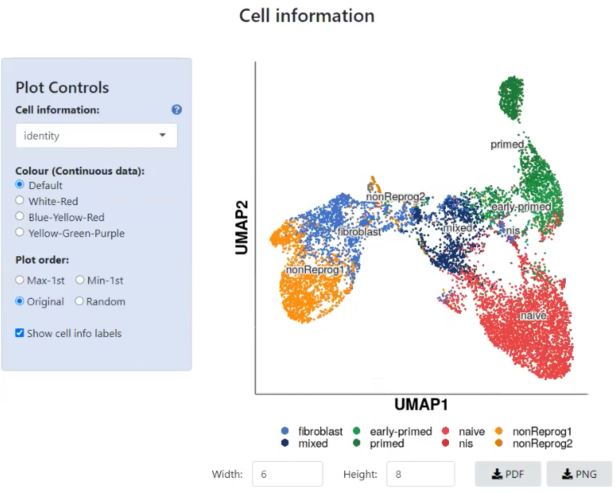
Customize your plot further in Plot Controls and choose which cell information to call out, pick its color coding and the order of the plot – click to enlarge
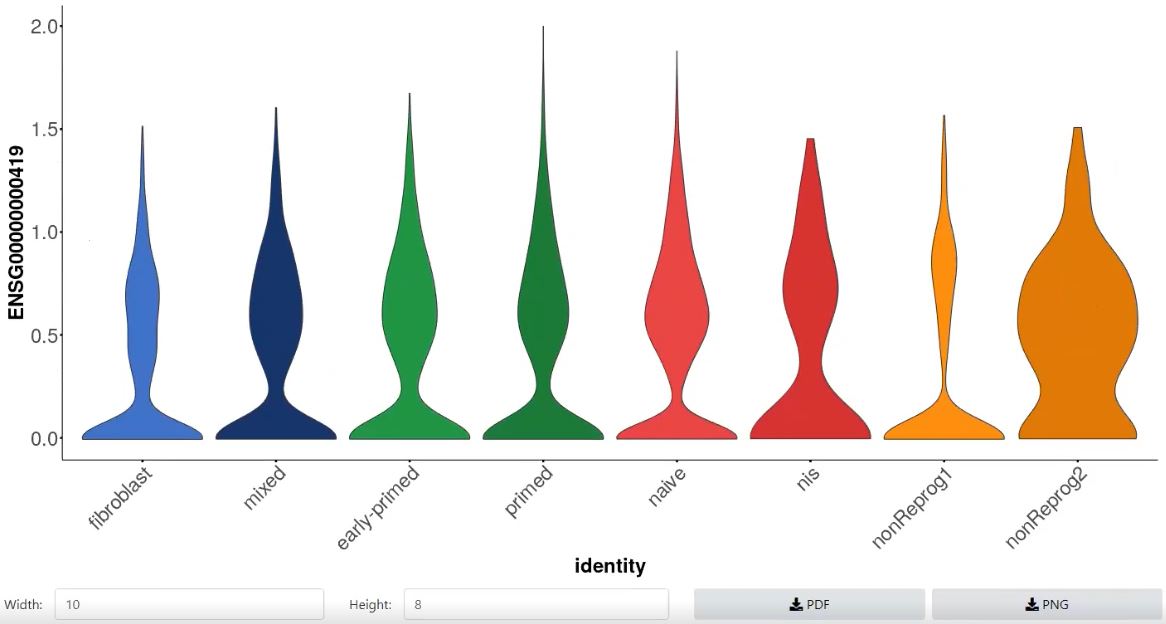
Example of a Violin Plot – click to enlarge
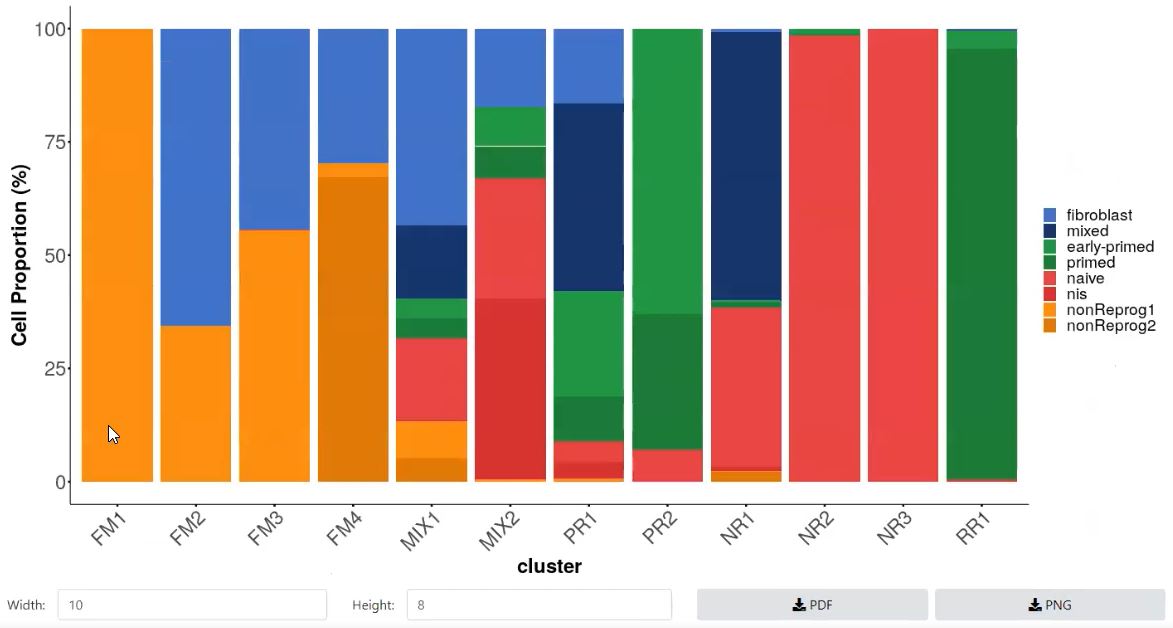
Example of a Proportion Plot – click to enlarge
Benefits of Excelra’s Single Cell Browser
Quick and easy access to single-cell transcriptomics data
No programming skills needed
A simple way to generate and export any type of visual that fits intended communications
Single Cell Browser features
- User-friendly interface with simple navigation and secure sign-in
- Complete range of plot types:
- Gene expression per cell (UMAP, t-SNE)
- Metadata per cell, i.e. condition, treatment (UMAP, t-SNE)
- Coexpression of two genes per cell
- Violinplot / Boxplot of gene expression
- Proportion Plot of cell abundances
- Bubbleplot / Heatmap of gene signatures
- Full customizability of plots, including clustering options, color scheme, plot size, font size, and many more. Plots can be directly copied or downloaded as png or pdf. Tabular summaries of displayed data support exact communication on expression levels and cell-type proportions.S3 app extension for easy and secure data sharing
Do you want to learn how we help with the Single Cell Browser?