Contributors: Aditya Iyer, Philge Philip, Tahseen Abbas, Ria Lodh, Debamitra Chakravorty
Introduction
Spatial transcriptomics analysis enables researchers to decode gene expression patterns while preserving the spatial context of cells across distinct regions of interest within tissues. Cells are the building blocks of life, but their interactions create a complex ecosystem that’s greater than the sum of its parts. Cells from different regions of an organ can have varied functions and belong to diverse cell types. Influenced by their unique microenvironments, cells receive and process distinct signals. Co-located cells communicate directly through chemical and mechanical signals, responding with changes in their own states. Understanding the spatial organization of cells in a tissue is key to unlocking insights into both cell and tissue function, which is crucial for life sciences research.
For years, bulk RNA sequencing provided general snapshots of gene activity, often masking key features. Single-cell sequencing improved this by offering detailed views of individual genes but still lacked context on how these genes interact spatially. Now, Spatial Transcriptomics (ST) bridges this gap by mapping gene expression within the spatial organization of cells.
This revolutionary technique has transformed research areas, particularly cancer studies, uncovering intricate spatial variations within tumors and helping identify potential therapeutic targets.
While this whitepaper explores different platform and methods available for ST—differing in terms of capture, resolution, throughput, and complexity— it also highlights Excelra’s deep expertise in handling ST data. We’ve also provided insights into how our solutions enable clients to better understand the tissue microenvironment they are studying. As a bonus, we offer a sneak preview of our in-house Nextflow pipeline, which adds immense value to spatial transcriptomics research.
Commercially Available Spatial Transcriptomics Platforms
ST technologies use different approaches to measure gene or isoform abundance in three dimensions, with variations in capture, resolution, throughput, and complexity.
Laser Capture Microdissection (LCM)-Based Approaches target specific areas for profiling using high-throughput technologies like RNA-seq. Spatial Barcoding-Based Transcriptomics involves capturing transcriptomic data by immobilizing tissue sections on slides, with reverse transcription primers containing spatial barcodes. 10X Genomics Visium offers a resolution of up to 55 μm, suitable for large and heterogeneous tissues, and has been widely used to study tumor microenvironments.
High-definition spatial transcriptomics (HDST) and other advanced methods like Slide-seq and Stereo-seq further enhance resolution and capture spatiotemporal characteristics of tissues. Slide-seq offers near to single cell resolution of up to 10 μm which means higher spatial resolution as compared to Visium technology. However, Slide-seq is not capable of handling FFPE samples. Slide-seq V2, which is an advanced version of Slide-seq offers higher sensitivity and better data quality. It has been used to analyze Diabetic kidney from human and mouse to identify disease specific cell neighborhoods (Marshall JL et al. 2022).
On the other hand, Imaging based methods such as 10x Xenium combine barcoding strategies with sequential hybridization and imaging to identify individual transcripts within fixed tissues. These methods are best suited for higher resolution studies at single-cell or subcellular level.
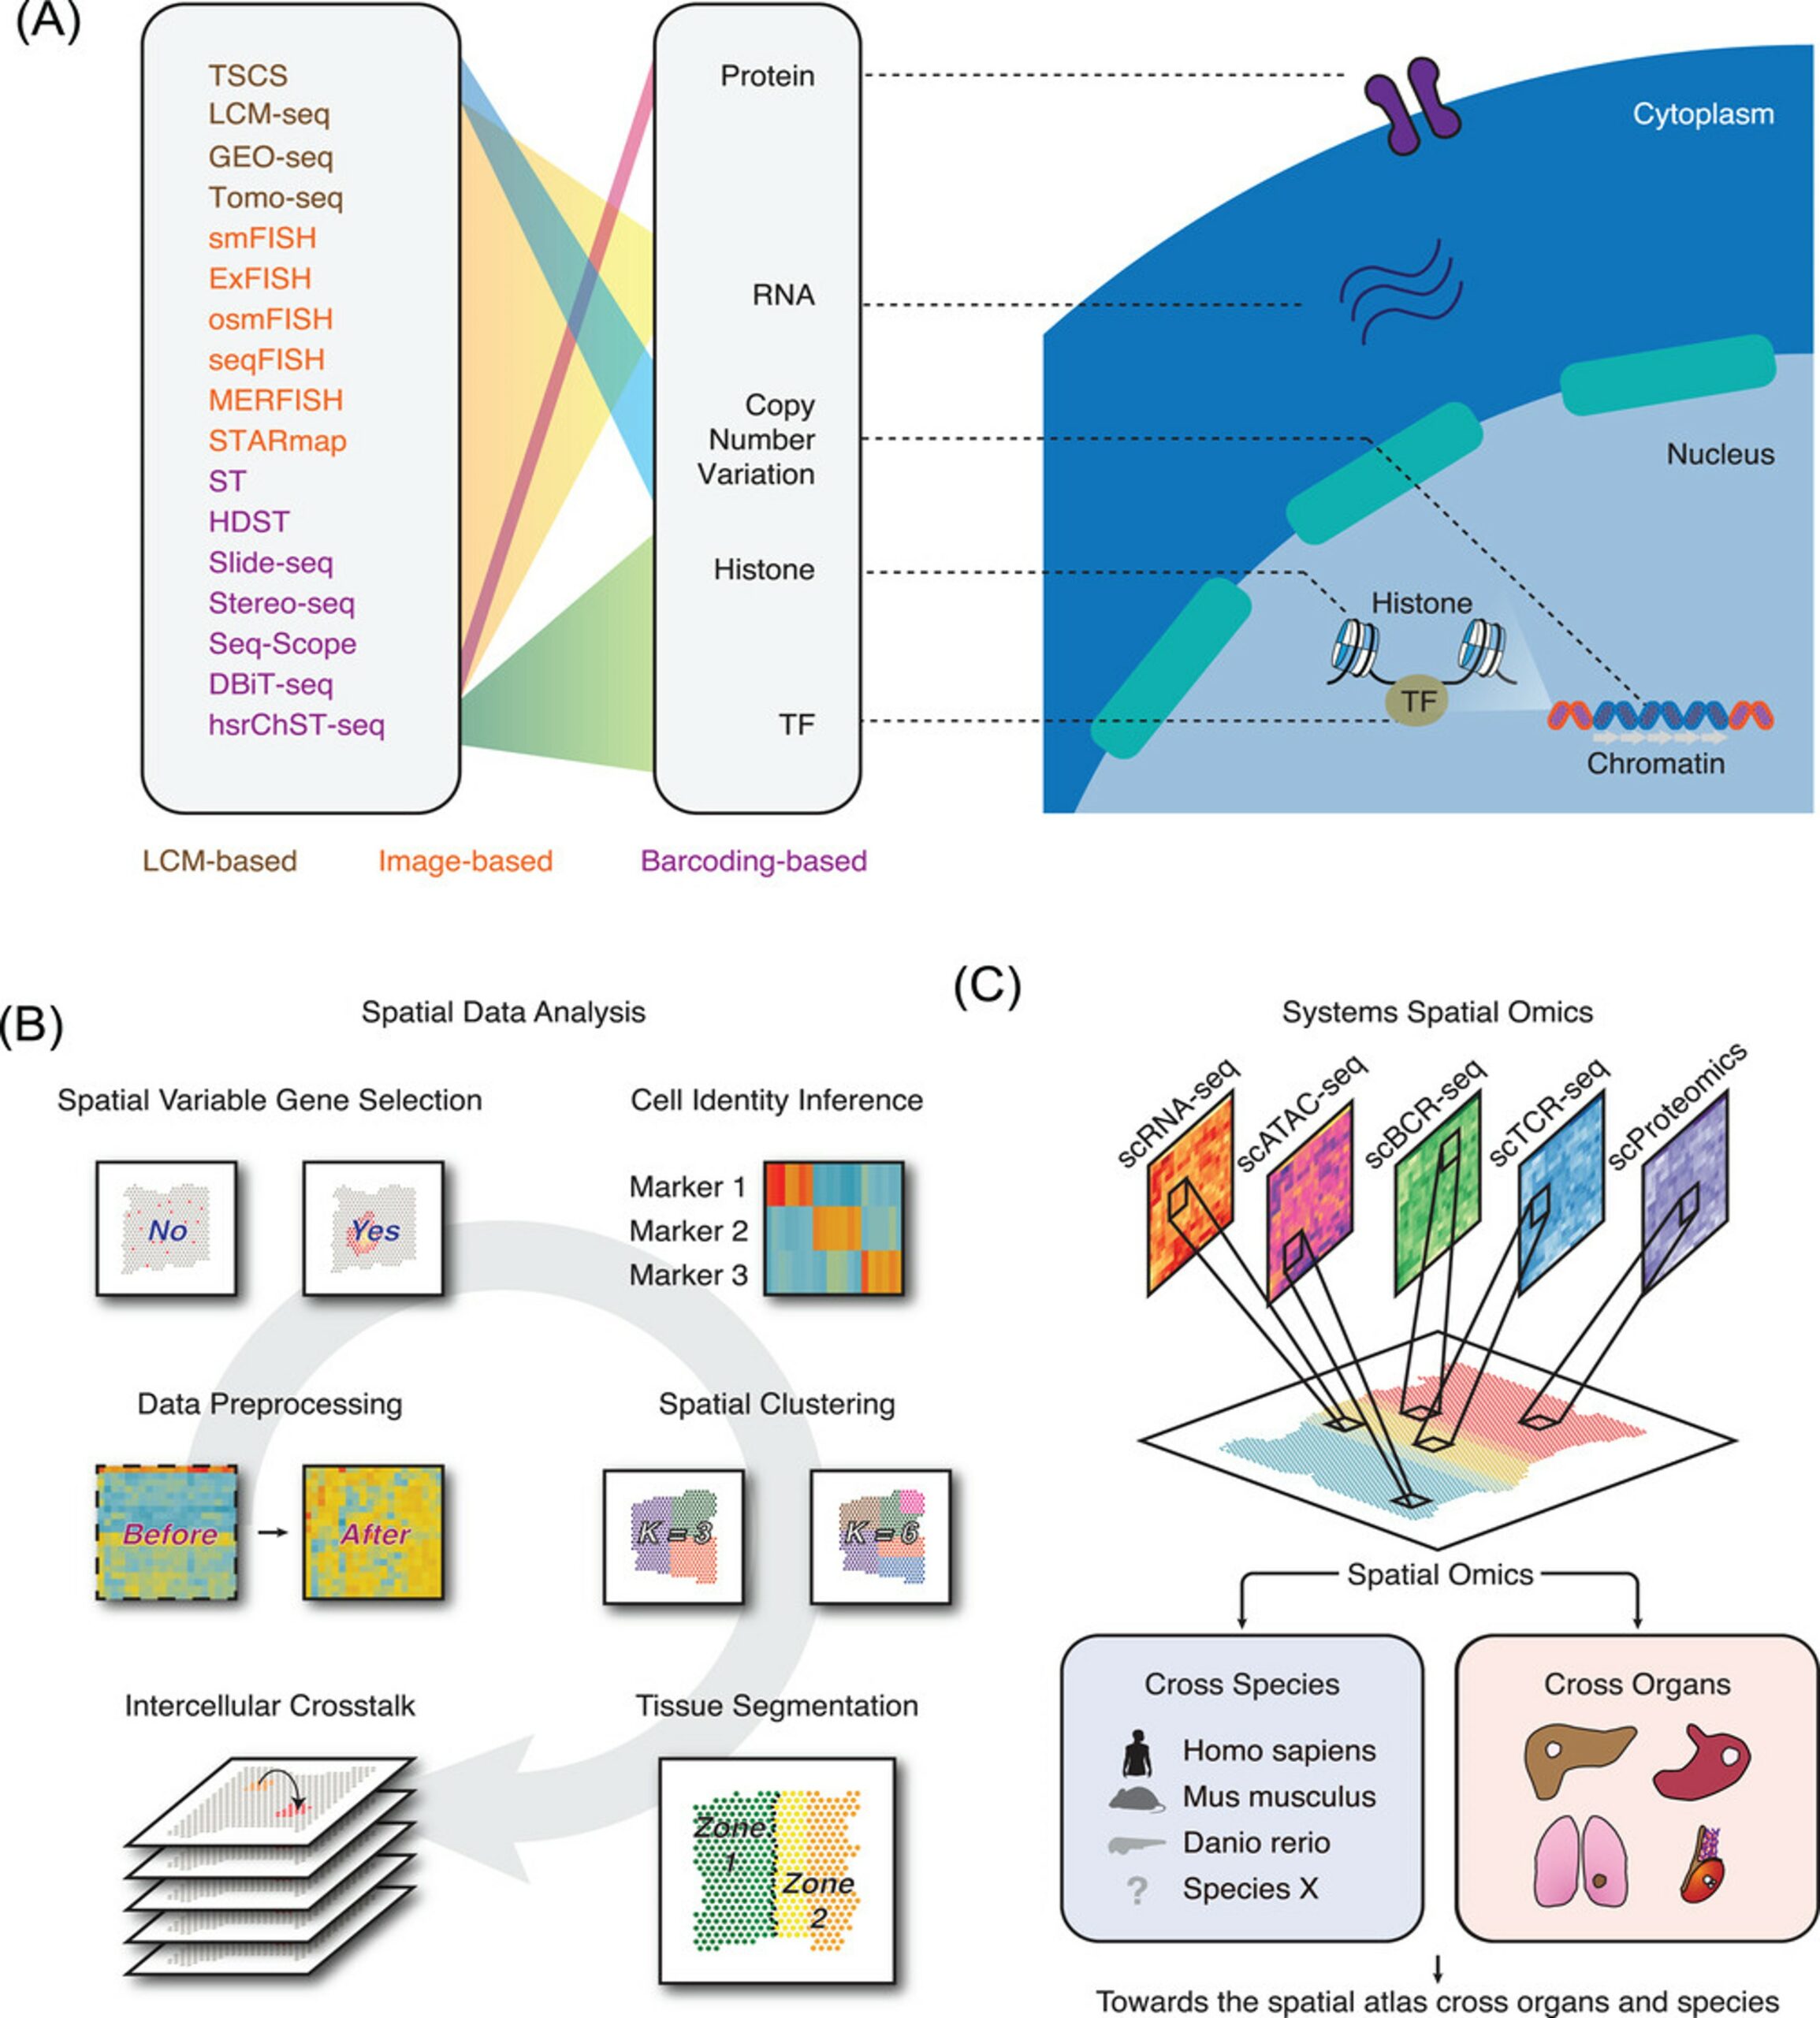
Figure 1: Spatial omics overview. (A) Summary of published spatial omics technologies. (B) The data analysis strategies which can be adopted in spatial omics data treatment. (C) Spatial omics can be utilised to study cancer samples across distinct species and distinct organs. Integrating spatial omics and other omics techniques can systematically decode the structure of tumour microenvironment (Wu et al. 2022).
High-definition methods like Slide-seq offer higher spatial resolution but are limited in their ability to handle certain samples. Technologies such as 10x Xenium combine barcoding with imaging, enabling single-cell or subcellular resolution.
The choice of technology depends on your research goal. For example, if you’re focused on specific genes, an imaging-based method may be ideal. For broader hypothesis generation, next-generation sequencing-based methods work best. ST is reshaping fields such as oncology and neuroscience by providing insights well beyond single-cell sequencing.
What one can do with ST data in comparison to single cell
Single-cell RNAseq provides an edge over traditional bulk RNA sequencing by enabling in-depth exploration of gene expression characteristics at single cell level. Researchers can perform differential expression analysis across different conditions on clusters derived from annotated cell types and identify cellular interactions from ligand-receptor pairs expressed in different cell types. Trajectory and Pseudotime inference could also be performed to understand dynamic processes such as differentiation or disease progression.
However, despite offering various applications, single-cell RNA sequencing approaches lack spatial information of cells which is required to understand how cells are organized within a tissue. This limitation has been overcome by the advent of spatial transcriptomics technologies that aim to preserve the spatial context of cells along with determining gene expression profiles. In addition, the generated ST data can further be subjected to wide range of advanced downstream analysis; some of which are covered below:
- Spatially Variable Features – The analysis helps in picking out key genes driving spatial patterns through statistical analysis. Spatially variable features help identify different cell types and structures within a tissue by revealing distinct gene expression patterns that correspond to specific cellular identities or functions (Zhao et al. 2022). By identifying such genes that are expressed differently across the tissue, researchers can delineate functional regions, such as the boundary between healthy and diseased tissue.
- Deconvolution – Each spatial spot in an ST experiment contains multiple cells. As such, the expression readout from the spot mixes together the expression of individual cells encompassed by it. Deconvolution is the approach for unmixing this combined expression signal. Most often, deconvolution methods predict the fraction of each spot’s expression derived from each cell type. This enables the analysis of cell type composition and heterogeneity across the tissue. Deconvolution can identify and localize different immune cell types within the tumor microenvironment, such as T cells, macrophages, and other immune infiltrates (Wu et al. 2021).
- Trajectory Analysis – Spatial trajectory inference integrates spatial data and gene expression to map cell development. Cells are grouped based on similar gene expression profiles, arranged into a trajectory tree to visualize developmental paths. Transition marker genes along these paths are identified to understand gene expression changes during cellular progression. Trajectory analysis can map the progression of cell differentiation within tissues, revealing how progenitors or stem cells transition into specialized cell types. This is especially useful for studying embryonic development or tissue regeneration. In cancer research, trajectory analysis can reveal the progression of tumor cells from a less aggressive state to a more malignant phenotype, mapping how gene expression changes contribute to tumor growth, invasion, and metastasis.
- Cell-Cell Communication – Cell clusters communicate through signals essential for biological functions. Communication pathways are identified and visualized in heatmaps, showing interactions between sender, receiver, mediator, and influencer cell types within biological systems. By analyzing communication networks in healthy tissues, researchers can identify the signaling pathways that maintain tissue homeostasis, ensuring proper function and response to minor perturbations. Spatial transcriptomics allows for the study of how neurons communicate with each other and with supporting glial cells, which is essential for understanding brain function, learning, memory, and neurodegenerative diseases.

Figure 2: Application scenarios of spatial transcriptomics. “Tissue Architecture” refers to studies that elucidate the spatial distribution of cell subpopulations in a specific tissue and decode intercellular interaction. “Tissue Development” represents research into resolving morphogenesis patterns and spatiotemporal gene expression of the transcriptome during the development course of a certain tissue or organ. “Disease Research” demonstrates disease microenvironment and pathogenesis, and among the disease research, tumor biology is an important part including tumor microenvironment and heterogeneity (Zhou et al. 2023).
How does Excelra support ST data analysis
- Automated end-to-end pipeline:
Excelra leverages an automated end-to-end Nextflow pipeline that handles spatial transcriptomics data. With a comprehensive solution, our pipeline ingests data from platforms such as 10X Visium or Xenium, ensuring fast, secure, and accurate results. By integrating state-of-the-art modules, our pipeline empowers researchers to explore spatial gene expression patterns, identify cell types, and generate actionable biological insights.
Building upon our capabilities with scRNA-seq technology, the spatial transcriptomics workflow consists of following components:
Data Loading & QC: Efficient ingestion of data, with rigorous quality control checks. The pipeline efficiently ingests 10X Visium or Xenium data, delivering fast, secure, and automated results. By integrating state-of-the-art modules, the pipeline empowers researchers to explore spatial gene expression patterns, identify cell types, and uncover biological insights. Implements rigorous quality control checks, including assessment of spatial count distribution, ribosomal gene, and mitochondrial gene percentage, to ensure data reliability. The pipeline operates with a sample sheet containing paths to fastqs and image (TIFF) files, along with sample metadata. However, efforts are underway in expanding the pipeline to even handle data from additional platforms like GeoMx, Slide-Seq etc.
i. Normalization: Detects spatially variable genes, providing insights into spatial distribution. Normalization method detects spatially variable genes, which are visualized and clustered using UMAP. This process provides insights into the spatial distribution of specific marker genes across clusters and identifies the optimal principal components that capture the most significant data variance.
ii. Downstream Modules: Customizable for specific research objectives, ensuring deeper insights. Based on the objective of the study, the pipeline can be personalized by selecting specific downstream analysis modules that come along (as an option), in addition to the analysis mentioned above. The core feature is the data integration function to compute residuals for all genes across multiple datasets, ensuring a cohesive and integrated data representation. This integration offers researchers deeper insights into spatial patterns, relationships, and phenomena. Moreover, the visualization tools like spatial feature plots, violin plots, and heatmaps offer a concise and visually informative display of expression distribution across different spatial locations or clusters.
iii. Downstream Modules: Customizable for specific research objectives, ensuring deeper insights. Based on the objective of the study, the pipeline can be personalized by selecting specific downstream analysis modules that come along (as an option), in addition to the analysis mentioned above. The core feature is the data integration function to compute residuals for all genes across multiple datasets, ensuring a cohesive and integrated data representation. This integration offers researchers deeper insights into spatial patterns, relationships, and phenomena. Moreover, the visualization tools like spatial feature plots, violin plots, and heatmaps offer a concise and visually informative display of expression distribution across different spatial locations or clusters.
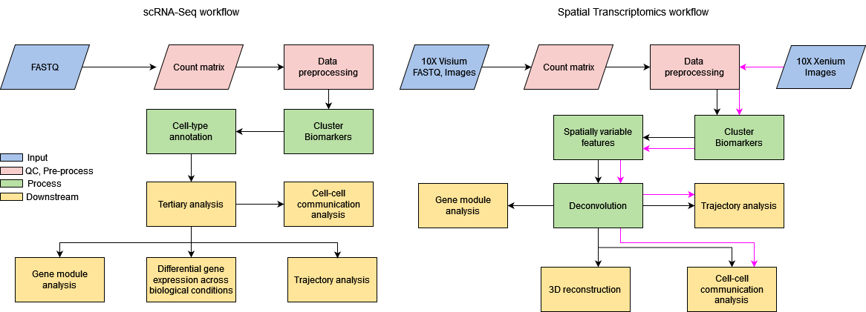
Figure 3: Comparison of Spatial Transcriptomics workflow with scRNA-Seq workflow .
iv. Output. The output is an annotated data object with cell types, spatially variable features, transition markers, statistical feature comparisons, insights into cell-cell interactions, and a 3D view of features. The HTML report containing plots for various analysis steps are also produced.
Bundled in the Nextflow format, the pipeline provides a quick initial overview from different data analysis modules. The features of such an automated end-end pipeline include high throughput, timesaving, consistency, and reproducibility.
- Our team of Subject Matter experts
Excelra truly believes in the synergy between technology and domain expertise. Our experts can go above-and-beyond the automation process that brings along limited flexibility, over-reliance on defaults, automated error propagation and difficulty in handling edge cases. A deeper customized analysis of the data can always be done through manual intervention. It is also essential to understand tissue morphology before proceeding with a spatial transcriptomics project. To achieve this, Excelra has team of PhD level scientists who are domain experts in multiple areas including oncology and immunology and are equipped to handle outputs from spatial transcriptomics data. The team analysis the datapoints emerging from the pipeline and provides the solution in a meaningful biological context. Apart from the current state of productionized pipeline, the team can also perform analysis on data coming from GeoMx, Slide-Seq. However, as we speak, parallel efforts are being implemented to enhance the pipeline’s capability to consider these platforms as well.
Our experts provide tailored analysis beyond automation, using a hands-on approach to adapt solutions to your specific needs.
A Case Study
The project aimed in analyzing GeoMx and Visium datasets to understand the functional role of a target in TME of multiple cancers. Publicly available spatial transcriptomics datasets offered an avenue to explore the “target” expression across the tissue space of multiple cancer contexts. To address this biological question, we performed within-ROI (region of interest) or across-ROI comparisons to ascertain the target’s putative function on neighboring cells across multiple cancer tissue slices. In within-ROI comparison, we identified the DEGs, pathways and cytokines that were differentially upregulated in high target hotspot region compared to low-target expression regions for every cell type. Whereas in across-ROI comparison, we compared target hotspot ROI and low target expressing ROI to identify differentially expressed genes. Using these approaches, we identified critical players, pathways linked to target function in space. Also, we performed correlation analysis using target gene expression with cellular abundances to understand whether expression was correlated to immune cell abundances in the TME. Despite the unavailability of standard tools to do such analysis in scalable fashion across multiple tissue slices, we implemented custom functions to carry out such novel analyses and have now developed a strategy to determine the potential target(s) functions using spatial transcriptomics modality for targets that do not have knockout models. This study highlighted the importance of spatial transcriptomics modality in understanding target function(s) most of which cannot be derived through other modalities including single-cell sequencing.
Conclusion
Spatial transcriptomics has transformed how we understand gene function within tissue architecture, revealing insights previously hidden by bulk and single-cell RNA sequencing. This powerful technique is particularly transformative in cancer research, enabling early detection, prognosis, and targeted drug development.
Excelra’s expertise in analyzing spatial transcriptomics data across platforms such as Slide-Seq, 10X Visium, and Xenium allows researchers to answer complex biological questions. Whether you’re identifying disease subtypes or uncovering the spatial organization of tissues, our analysis techniques provide the clarity you need.
With Excelra’s Nextflow pipeline and a team of experts, we enable you to uncover new frontiers in gene expression research. Where data means more, Excelra helps you turn spatial transcriptomics insights into tangible breakthroughs.
References
- Wu Y, Yang S, Ma J, Chen Z, Song G, Rao D, Cheng Y, Huang S, Liu Y, Jiang S, Liu J, Huang X, Wang X, Qiu S, Xu J, Xi R, Bai F, Zhou J, Fan J, Zhang X, Gao Q, Spatiotemporal immune landscape of colorectal cancer liver metastasis at single-cell level, Cancer Discov. 12 (2022) 134–153. PMID: 34417225.
- Zhao N, Zhang Y, Cheng R, Zhang D, Li F, Guo Y, Qiu Z, Dong X, Ban X, Sun B, Zhao X, Spatial maps of hepatocellular carcinoma transcriptomes highlight an unexplored landscape of heterogeneity and a novel gene signature for survival, Cancer Cell Int. 22 (2022) 57. PMID: 35109839.
- Wu R, Guo W, Qiu X, Wang S, Sui C, Lian Q, Wu J, Shan Y, Yang Z, Yang S, Wu T, Wang K, Zhu Y, Wang S, Liu C, Zhang Y, Zheng B, Li Z, Zhang Y, Shen S, Zhao Y, Wang W, Bao J, Hu J, Wu X, Jiang X, Wang H, Gu J, Chen L. Comprehensive analysis of spatial architecture in primary liver cancer. Sci Adv. 2021 Dec 17;7(51):eabg3750. PMID: 34919432.
- Zhou R, Yang G, Zhang Y, Wang Y. Spatial transcriptomics in development and disease. Mol Biomed. 2023 Oct 9;4(1):32. PMID: 37806992.
- Wu, S.Z., Al-Eryani, G., Roden, D.L. et al. A single-cell and spatially resolved atlas of human breast cancers. Nat Genet 53, 1334–1347 (2021). PMID: 34493872.
- Marshall JL, Noel T, Wang QS, Chen H, Murray E, Subramanian A, Vernon KA, Bazua-Valenti S, Liguori K, Keller K, Stickels RR, McBean B, Heneghan RM, Weins A, Macosko EZ, Chen F, Greka A. High-resolution Slide-seqV2 spatial transcriptomics enables discovery of disease-specific cell neighborhoods and pathways. iScience. 2022 Mar 16;25(4):104097. PMID: 35372810.
- Yuheng C. Fu, Arpan Das, Dongmei Wang, Rosemary Braun & Rui Yi. scHolography: a computational method for single-cell spatial neighborhood reconstruction and analysis. Genome Biology 2024. volume 25. PMID: 38915088.
How can we help you?
We speak life science data and help you unlock its potential.