Predictive modeling with ADME data
It’s estimated that nearly one out of every two drug candidates will fail at the clinical trial stage due to insufficient efficacy, and up to two out of every five have previously failed due to toxicity.[i] [ii] Regulators and researchers now recognize that, in addition to pharmacological properties, absorption, distribution, metabolism, and excretion (ADME) studies are critical to a drug candidate’s success. For over a decade, pharmaceutical companies have used rule-based filters such as Lipinski’s rule of five to avoid undesirable ADME profiles. More recently, they’ve begun to rely on predictive modeling.
Predictive models are used to assess a drug’s ADME profile, so data scientists require high volumes of ADME data to train their algorithms. Data volume is crucial, but so too is data diversity. The more unique compounds in a data set, the greater the probability of accurate predictions. This article introduces the importance of structural diversity in ADME data and compares GOSTAR® and ChEMBL to ascertain which database is most suitable for improving accuracy in predictive models. Following a thorough overlap analysis, our results show that the diversity of GOSTAR® data is 2x to 7x greater than that of ChEMBL.
Data coverage and quantity: critical to accurate pharmacokinetic predictions
Accurately predicting the behavior of a drug candidate in the human body is critical to drug discovery and development. Pharmacokinetics are generally grouped into four categories: absorption, distribution, metabolism, and excretion (ADME). Computational chemists and data scientists build artificial intelligence (AI) and machine learning (ML) models to analyze ADME data and predict the efficacy and safety of drug candidates. Candidates with the highest probability of successful interaction with a target and a low chance of side effects progress through the drug development program toward clinical testing. It’s vital, therefore, that AI/ML models are able to predict drug behavior accurately.
Inaccurate predictions can have serious consequences, not least in the wasted expense of significant time and money. Yet it is rarely the models and algorithms that are responsible for the inaccuracy. More often than not, the culprit is the data.
One of the key factors determining data quality is the number of unique compounds included in the set.
Given the importance of accurate ADME predictions in drug development, it’s imperative that ML models are trained on ADME data with a high number of unique compounds. To increase confidence in a model’s predictions among stakeholders facing go/no-go decisions about progressing potential drug candidates, data scientists must choose a data source with the requisite level of structural diversity across ADME parameters.
Comparing data diversity in GOSTAR® and ChEMBL
Two of the most popular sources of data for building predictive models are GOSTAR® and ChEMBL. Both are used by medicinal chemists, computational scientists, pharmacologists, and toxicologists to support drug discovery and development programs. The quality of their data is highly regarded in the pharmaceutical industry, and both GOSTAR® and ChEMBL incorporate manual curation processes to maintain quality standards.
There are, however, some major differences. Not least of which is the quantity of data; GOSTAR® substantially exceeds the number of compounds, bioactivities, literature assets, and patents found in ChEMBL (Table 1).[iii]
| Database | Compounds | Bioactivities | Scientific literature | Patents |
| GOSTAR® | 9.4 million | 32 million | 208,901 | 90,614 |
| ChEMBL | 2.4 million | 20 million | 83,415 | 2,564 |
Table 1: Comparison of GOSTAR® and ChEMBL database size
But an advantage in volume would be inconsequential if not matched by diversity. How does GOSTAR® data contrast with ChEMBL data in this critical respect?
Determining compound coverage using KNIME
To compare the molecular similarity of GOSTAR® and ChEMBL compound sets, we used the Konstantz Information Miner (KNIME). KNIME is an open-source data analytics, reporting, and integration platform with tools and workflows for building machine learning and data mining models.[iv] We selected a broad selection of ADME parameters and collected the search results from GOSTAR® and ChEMBL.
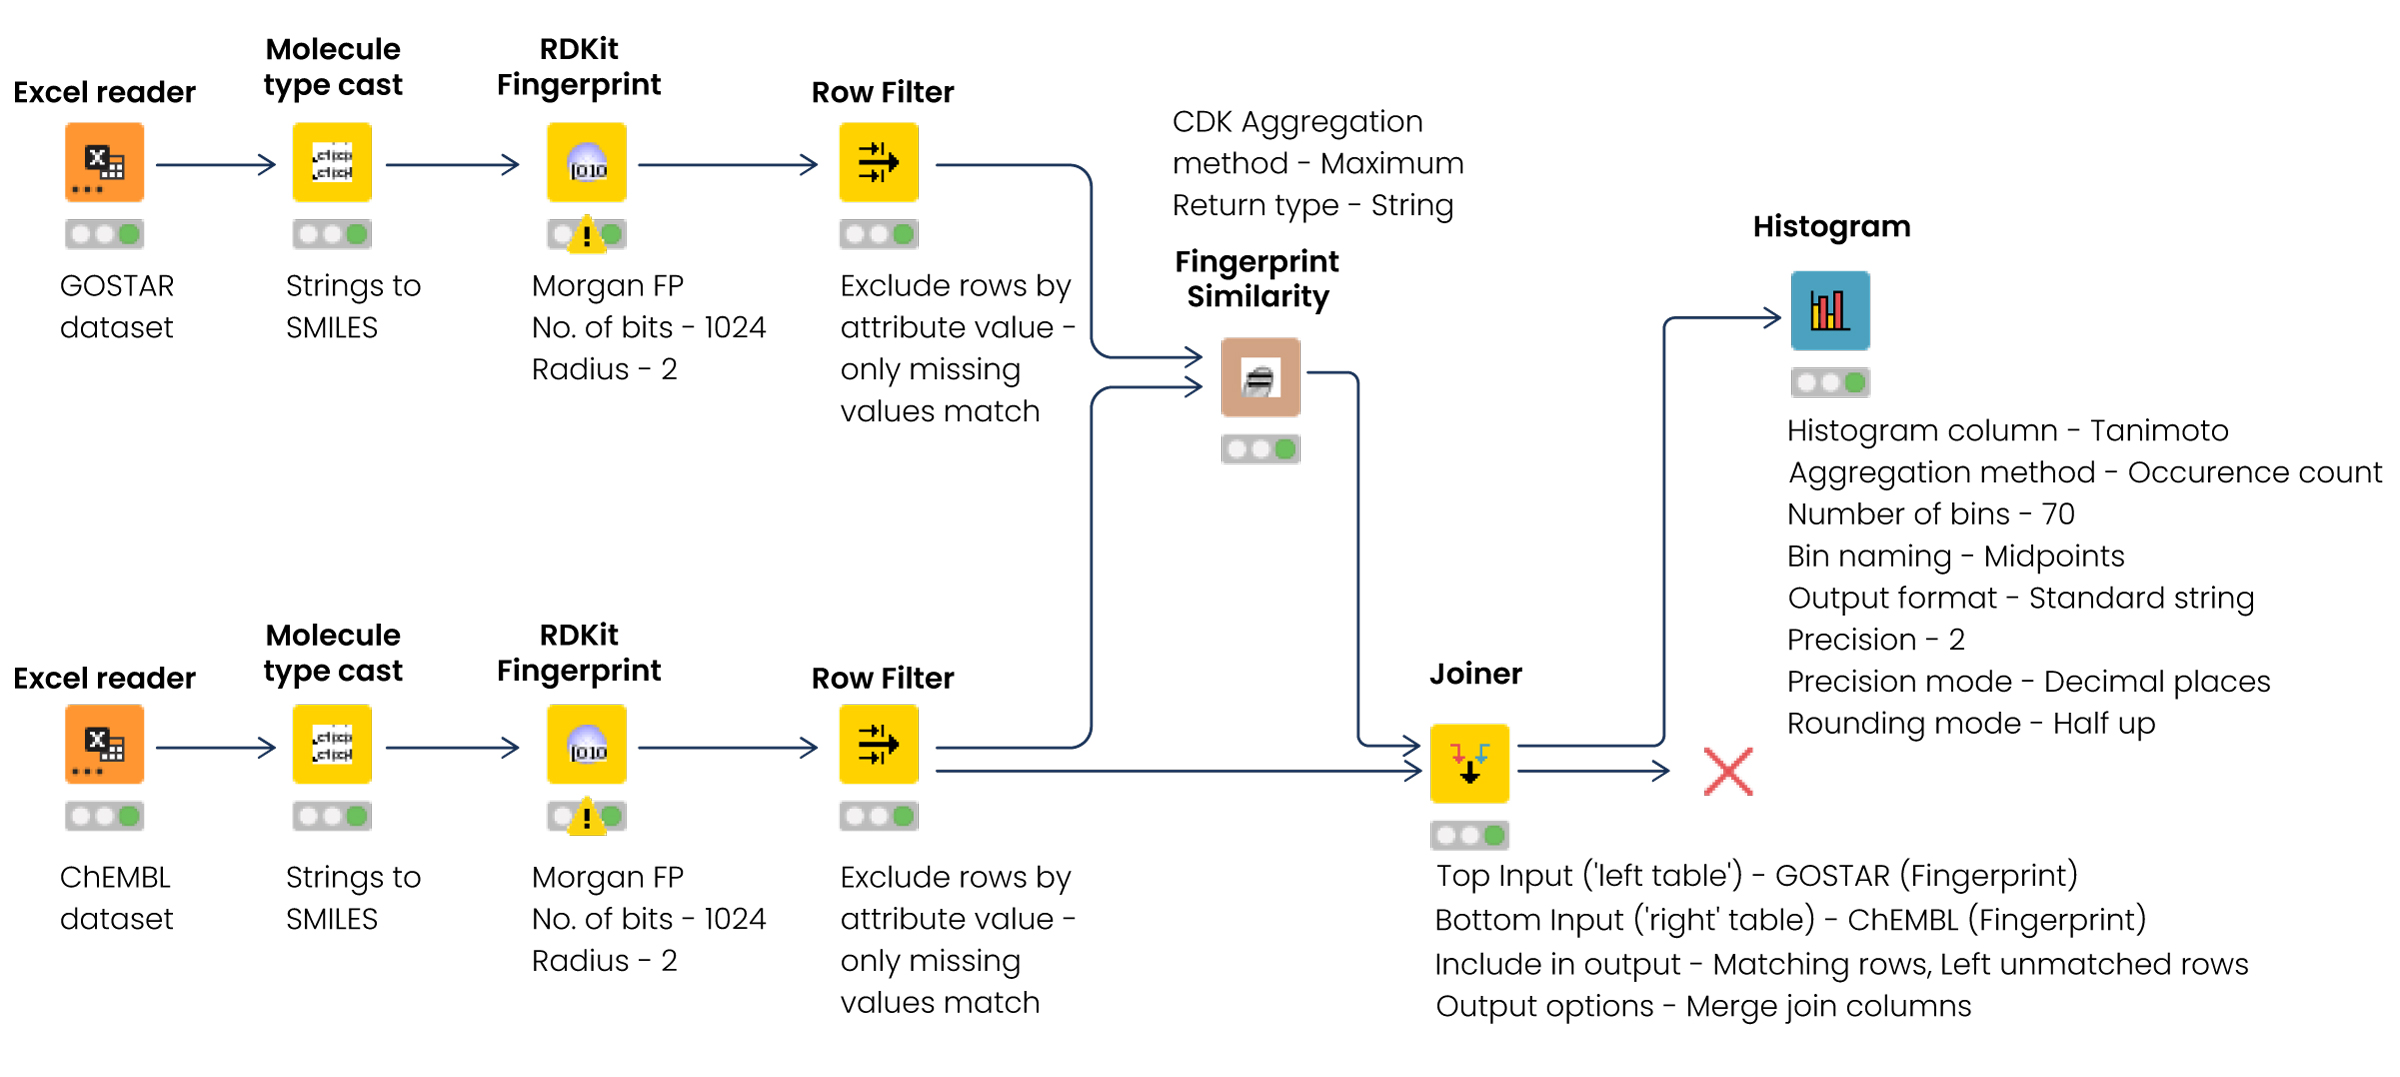
We uploaded and parsed the files into KNIME and converted the strings into a simplified molecular-input line-entry system (SMILES) with the Molecule Type Cast node. Then we used the RDKit Fingerprint node to generate hashed, 1024-bit Morgan fingerprints with a circular radius of 2, which have been shown in the literature to provide faster and comparable results when searching for molecular similarity than other fingerprints with higher bit length and radius.[v] The Tanimoto similarity coefficient in the two tables was calculated using a Chemistry Development Kit (CDK) fingerprint similarity node. Finally, we joined the node results using the Joiner node, and the outcome was visualized using a histogram node (Fig.1).
Figure 1: Workflow to analyze the molecular similarity between two datasets
Establishing GOSTAR®’s data superiority
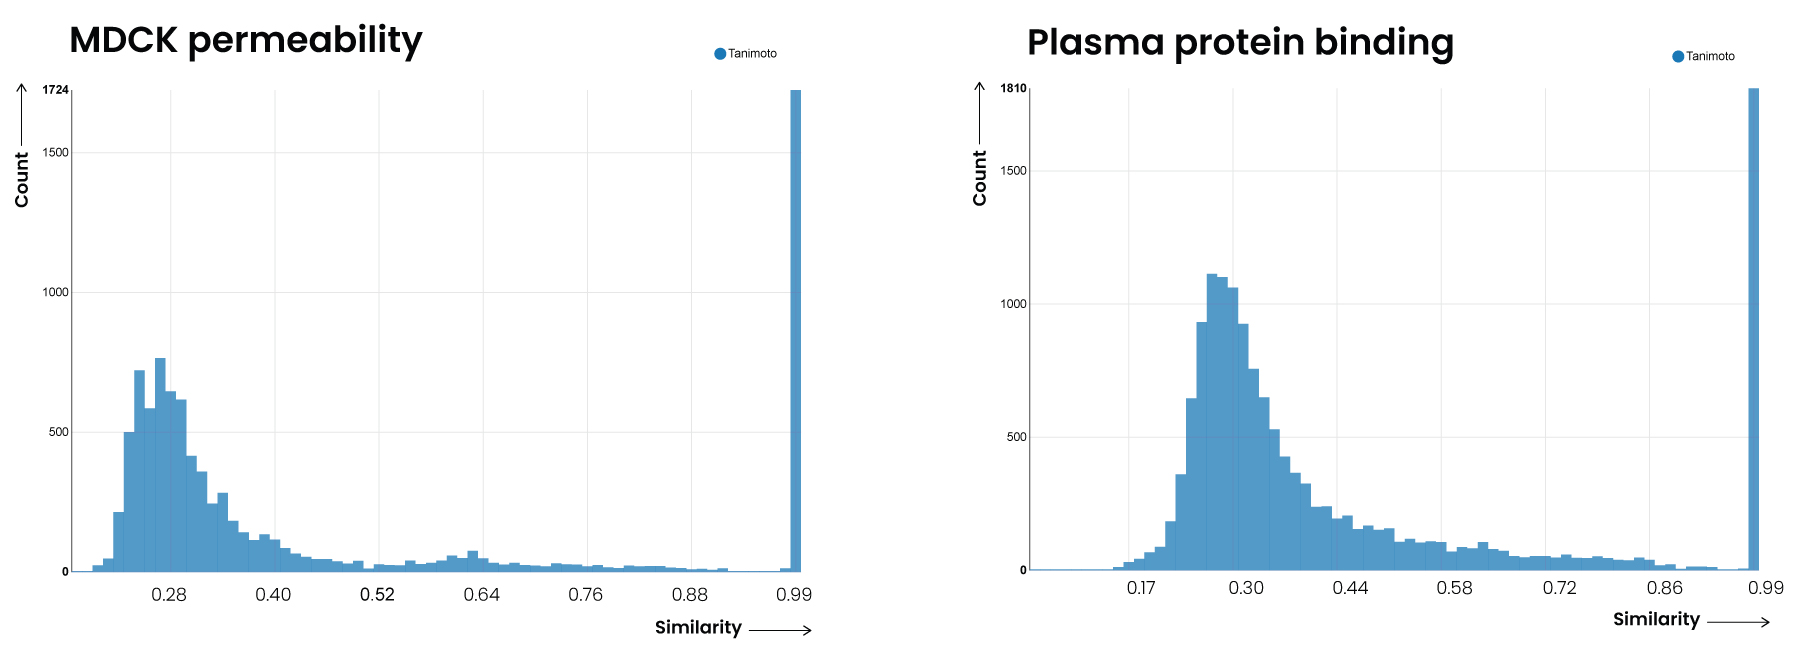
The results of the overlap analysis are clear. The number of unique compounds in GOSTAR® ranges between 2x and 7x that of those overlapping with the ChEMBL database (Table 2).
| ADME Parameter | No. of compounds in ChEMBL | No. of compounds in GOSTAR® | Overlap* | Unique compounds in GOSTAR®** | Mode |
| Caco-2 permeability | 7,277 | 13,616 | 3,475 | 10,147 | 0.29 |
| LogD | 25,550 | 25,836 | 12,263 | 13,743 | 0.34 |
| Madin-Darby canine kidney (MDCK) permeability | 6,479 | 9,205 | 1,723 | 7,482 | 0.27 |
| Plasma protein binding (PPB) | 3,967 | 14,838 | 1,808 | 12,968 | 0.28 |
| Human hepatocyte clearance | 1,096 | 2,937 | 601 | 2,331 | 0.25 |
| Rat hepatocyte clearance | 1,129 | 2,763 | 629 | 2,135 | 0.24 |
| Human liver microsomal clearance | 9,252 | 14,819 | 4,388 | 10,478 | 0.32 |
| Rat liver microsomal clearance | 4,492 | 6,872 | 2,292 | 4,609 | 0.30 |
Table 2: Comparison of unique compounds in GOSTAR® and ChEMBL
*Overlap = Number of compounds with fingerprint similarity of 1 between ChEMBL and GOSTAR®
**Unique compounds in GOSTAR® = <0.98 Tanimoto similarity

The test establishes without doubt that GOSTAR® contains more unique chemical structures for exemplified ADME parameters than ChEMBL. The implications of GOSTAR®’s clear advantage in diversity are profound. Data scientists and computational chemists seeking greater accuracy from their predictive models are better served with ADME data from GOSTAR® than from ChEMBL.
GOSTAR® data delivers greater predictive accuracy in ML models
Structural diversity in the data used to train ML models is one of the key indicators of their predictive accuracy. It’s therefore essential that the number of unique compounds is a major consideration when selecting a data source.
The results of our overlap analysis reveal a distinct advantage for GOSTAR® data when compared to ChEMBL data. Aligned to its significantly larger database and the quality of its manually curated content, GOSTAR® is clearly the better data source for drug discovery and development programs employing predictive modeling.
GOSTAR® provides comprehensive, reliable, high-quality data to global pharmaceutical and biotech companies seeking their next major breakthrough. To find out how GOSTAR® can help you achieve your objectives, we’d love to hear from you.
References:
i. Kennedy, T. (1997, October). Managing the drug discovery/development interface. Drug Discovery Today, 2(10), 436–444. https://doi.org/10.1016/s1359-6446(97)01099-4
ii. DiMasi, J. A. (1995, July). Success rates for new drugs entering clinical testing in the United States. Clinical Pharmacology & Therapeutics, 58(1), 1–14. https://doi.org/10.1016/0009-9236(95)90066-7
iii. ChEMBL Database. Retrieved March 3, 2023, from ChEMBL website: http://www.ebi.ac.uk/chembl/
iv. KNIME: Open for innovation. Retrieved February 22, 2023, from KNIME website: https://www.knime.com/
v. Landrum, G. (n.d.). RDKit 2012 UGM. Retrieved 6 March 2023, from Rdkit.org website: https://www.rdkit.org/UGM/2012/
How can we help you?
We speak life science data and help you unlock its potential.


