
Growth in technology has been attributed to the strong association between computational power and Big Data. Data Management has been the corner stone for this evolution in the field of technology. Management of data has helped in saving time, money and reducing efforts, which has helped in delivering attention to more complex fields.
How to build a predictive analytics engine?
Building a predictive analytical algorithm entirely depends on its foundation i.e. the data and the subsequent processes involved. Due to sequential nature of the process, it becomes highly imperative to be cautious at each step as an error at any point will affect the overall prediction quality. Be it at the data level or the right algorithm selection, or even while defining the front-end experience (which a user journeys through while using the platform); multiple factors play important roles in meeting the objective. Therefore, this article attempts to highlight certain rules, which one must consider while building a predictive engine.
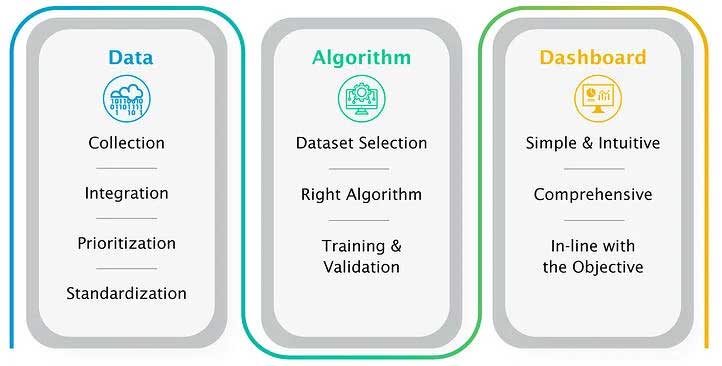
Figure 1: Key aspects of building a Predictive Analytical Platform
Data Handling:
The internet freedom has undoubtedly played a catalytic role in the fast-developing world but on the other hand, it does evoke skepticism about the genuineness of floating information. Therefore, identifying reliable data sources becomes the very first important step. Rather than extracting information from unreviewed-public records, it’s always advisable to get the data from reputed organizations/institutions which are solely dedicated in maintaining the required information. Once decided, following steps come into the effect
- Extraction: The data extensity within a specific data source completely depends on the interest/purpose of the holding organization. Their objective may or may not align with yours. In the former case, chances are that you get the entire longitudinal/latitudinal data but in the latter situation, the data can only serve your partial need. Therefore, it’s better to tap various sources to gain surety over the data size & quality.
Even the process of extraction also tends to differ. Unlike for the situation where the holding data source provides easily downloadable data; techniques like web-scraping, data-mining & parsing have come into rapid use. Based on the web architecture, manual efforts at times are also needed to mine the data meticulously. - Integration: Bringing the data from multiple sources under one roof can be a bit challenging. However, this step should be done while preserving the pattern coming from a single source. This ensures that the relation between the data & variables is not lost during integration. This step provides a sense on the entire data dimensions in a broader way.
- Prioritization/Feature selection: While extracting data, it is quite possible that the source page doesn’t allow to download the specific required information. This is quite common where certain data repositories only allow you to download the entire data dump. Therefore, once downloaded, the variables specific to the needs should only be considered, excluding the remaining ones. This tends to avoid the noise effect in the platform’s performance.
- Standardization: The objective of this step is to analyze the distribution and determine whether the data is normally distributed or if it is skewed towards any specific variables, or if any outliers co-exist. Finetuning the data to avoid skewness is really important as it avoids the platform getting biased towards any variable. Moreover, the experience while running UI would be uniform and no randomness coming from the nature of the data would be observed.
Algorithm selection:
In today’s world, smart technologies are mainly driven by series of well-scripted codes, the algorithms. Based on the objective one should choose the right algorithm fitting the purpose, as while one algorithm might perform well in a certain instance, it may fail to provide good results within another set of instances. Also, it is not always necessary that the implementation of bootstrapping techniques lets you meet the objective. Sometimes, there might be a need for building one from ground zero by compiling multiple statistical methods. But while doing so, one must select the training set cautiously. It should be devoid of any biases, should well represent all the possibilities of the realistic scenario and the strength of the training set should such be chosen that there is still a section for concept proofing.
Dashboard development:
Choosing the right interface for the platform is the last but most important step towards goal completion. While deciding the design, one must consider the intuitive experience a user should have while handling the platform. It should be interactive, thereby allowing the user to take control as per his requirements. This not only gives confidence to the user but also enhances the sense of trust he can put in on the back-end functioning principles of the platform. Selection of colour schemes, animations & fonts should be well balanced as it adds to the visual aesthetics. The most important aspect is testing the application on multiple resolution sizes and environments. This allows a fool-proof check on how the platform adapts when being run on various screen resolutions.
Case Study
Objective
The manufacturing & usage of chemicals has provided a significant support to the modern-day society but handling and maintaining the workplace environment is extremely important. Specially, in the Manufacturing Industries, where the workers are constantly exposed to all sorts of chemicals, their health safety should be of utmost priority. Aligning with this concern, we helped a Big Pharma Company in building an algorithm to predict the Occupational Exposure Limits (OEL) & Hazard Information for known as well as unknown compounds. Such an application ensures occupational health of employees and eventually helps the Client to maintain proper safety standards, providing an advantage of investing the allotted budget to other important tasks.
Approach:
Going with such notion, we developed a web-based application by integrating multiple datasets containing OEL values as well as related hazardous information for variety of chemicals. Due to sparsity of OEL data in the public space and region-wide variation in the acceptable values, special attention was made while harmonizing the data to preserve the original data connections. Moreover, since the information was pooled from various data sources, the values specific to the Unit of Measurements (UoMs) were carefully normalized, preserving inter-dependent relations with other variables.
A given chemical may also have different OELs based on geographical location, therefore, the region was well retained and allows the user to see associated OEL/Hazard descriptors in a region-wise manner. Compound-centric details were also collected from the public as well as our proprietary SAR database. Several techniques ranging from automation to manual intervention, were implemented resulting in a comprehensive uniform data structure.
All this data became the foundation for the application comprising a ‘structural similarity algorithm’ able to infer the OEL values for new chemical substances or categorize it into any of the three categories as per the Industrial Standards (Highly toxic, Handle in contained environment, Safe to handle in open environment). Prior to the deployment of the built algorithms into the front-end, thorough validation checks on its functioning was also performed and certain parameters were deliberately decided to avoid the appearance of false-positive/negative predictions.
Solution:
Following the above set of principles, we built applications from ground zero. Starting with the data and its processing, followed by algorithm development and dashboard creation, the OEL application ensures safety and occupational health of Client employees & helps the company to channelize time, money and efforts towards other important tasks. The user can query the application using SMILES format of a chemical substance or even by drawing the structure using Chemsketch tool. The OEL value predicted by the platform helps the chemist to understand the appropriate handling environment for a given chemical, when not much information is available in the public domain. The application additionally suggests proper measures to maintain work environment safety.
The Excelra Edge
Strongly believing in the key aspects discussed above, we build and deliver applications that add value to our Clients. Starting with the data, its processing, algorithm development, followed by front-end creation, our team involving SMEs, takes proper measures to ensure overall build quality. Moreover, Excelra has an advantage in bringing workforce from different professional backgrounds to work seamlessly on a given objective. Based on the nature of the task, we pool in experiences from verticals ranging from computational experts, data analysts, chemists, biologists, and even front-end UI developers.